AIXI price action has recently shown significant movement across both price and volume, giving traders several different structures to examine rather than one obvious setup to assume.
The stock closed at about $1.23 on October 1, 2026, after trading between $1.18 and $1.33 during the session. Recent sessions have also produced different levels of volume, including more than 4.5 million shares on September 24 compared with roughly 282,000 shares on October 1.
That variation makes market structure particularly important. A sharp move does not automatically represent a breakout, while a decline after a previous move does not necessarily qualify as a pullback.
Traders can instead examine the sequence of highs and lows, important price areas, volume, and whether price accepts or rejects a particular level before assigning a setup.
In this article, we will examine how traders can evaluate AIXI price action through three possible structures: a range, a breakout, or a pullback. The goal is not to predict which structure will develop, but to explain what evidence can help distinguish one condition from another.
What Does AIXI Price Action Tell Traders?
Price action is the study of how an asset moves over time through its highs, lows, opens, closes, and reactions around important price levels.
For AIXI, recent historical data provides a useful example of why context matters. The stock moved from a September 22 high of $2.16 to a September 29 high of $1.94, before closing at $1.49 on September 29. It then closed at $1.39 on September 30 and around $1.23 on October 1.
That sequence gives traders several things to investigate:
- Are recent highs and lows forming a consistent structure?
- Are previous support areas continuing to hold?
- Are price movements becoming wider or narrower?
- Is trading volume increasing during important moves?
- Is price establishing a new range after a larger movement?
- Has a previous level actually been broken and held?
These questions are more useful than labeling the chart after a single large candle.
Three Possible Structures: Range, Breakout, or Pullback
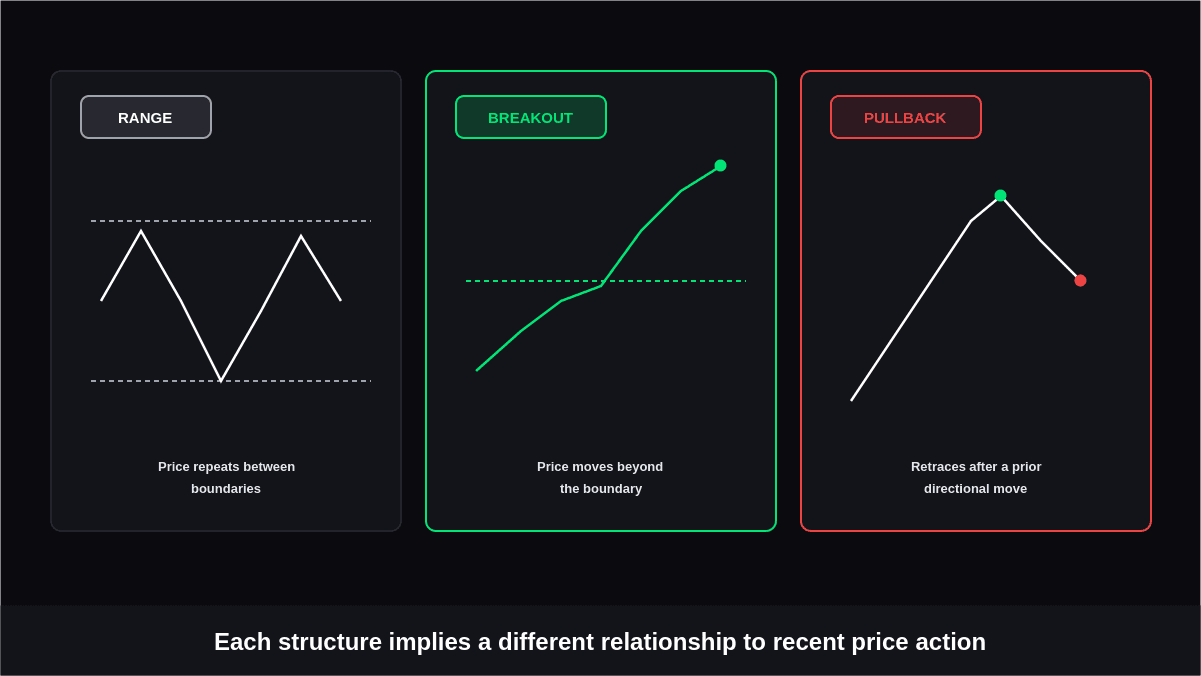
AIXI price action can generally be viewed through three possible structures: a range, a breakout, or a pullback. Each reflects a different relationship between the current price and its recent market movement.
A range occurs when price moves between established upper and lower boundaries.
A breakout develops when price moves beyond a recognized boundary, while a pullback occurs when price retraces after a previous directional move.
Identifying which structure is developing provides context before evaluating a potential setup. The same price movement can have a different meaning depending on whether AIXI is ranging, breaking from its structure, or retracing within an existing trend.
Could AIXI Be Trading Within a Range?
A range occurs when price repeatedly moves between an identifiable upper boundary and lower boundary without establishing a sustained move outside that area.
The important point is that a range is defined by repeated price behavior, not simply by two arbitrary levels drawn on a chart.
How Traders Can Identify a Range
Several characteristics can make a range more recognizable:
- Price repeatedly approaches an upper area and retreats.
- Price repeatedly reaches a lower area and rebounds.
- Neither side establishes sustained control outside the boundaries.
- Multiple candles or sessions develop between the same general areas.
- Trading activity remains concentrated inside the established structure.
For AIXI, traders should avoid declaring a range simply because recent prices have moved sideways for a few sessions. The structure needs enough repeated reactions to distinguish a meaningful consolidation from ordinary short-term fluctuation.
Range Highs and Range Lows Matter
Once a potential range becomes visible, traders can mark its upper and lower boundaries.
The range high represents an area where upward movement has previously encountered selling or resistance.
The range low represents an area where downward movement has previously encountered buying or support.
The middle of the range generally provides less information about whether the boundaries will hold. The more useful observations often occur when price approaches either edge.
What Can Invalidate the Range?
A range can lose relevance when price establishes itself outside one of its boundaries.
However, one brief move beyond the boundary is not necessarily enough to confirm a structural change. Traders can examine whether price remains outside the range, whether follow-through develops, and whether volume changes meaningfully.
This distinction is particularly important for volatile stocks because temporary moves through a level can occur without producing a lasting change in structure.
What Would a Breakout in AIXI Look Like?
A breakout occurs when price moves beyond a previously established structural boundary.
For AIXI, the relevant boundary could come from a recent range high, resistance zone, or another clearly established swing level. But identifying the boundary is only the first step.
Elements Traders Can Examine During a Breakout
A potential breakout can be evaluated through several factors:
- Level: What specific resistance or support has price moved beyond?
- Distance: Did price move marginally beyond the level or make a more substantial move?
- Volume: Did trading activity increase alongside the move?
- Follow-through: Did price continue in the direction of the break?
- Retest: Did price return to the former boundary and show a reaction?
- Acceptance: Did price remain outside the previous structure?
None of these factors guarantees that a breakout will succeed. They simply give traders additional information for determining whether the move represents a meaningful structural change.
Why a Break Above Resistance Is Not Automatically a Breakout
Suppose AIXI trades above a previous resistance level during one session.
That observation alone establishes that price moved beyond the level. It does not establish that the market will remain there.
If price later falls back below the same level, the initial move may have been a failed breakout. If price holds above the area and establishes new highs, the structural interpretation becomes different.
This is why traders often examine confirmation after the initial level breach rather than treating the first move through resistance as conclusive.
How to Distinguish a Failed Breakout
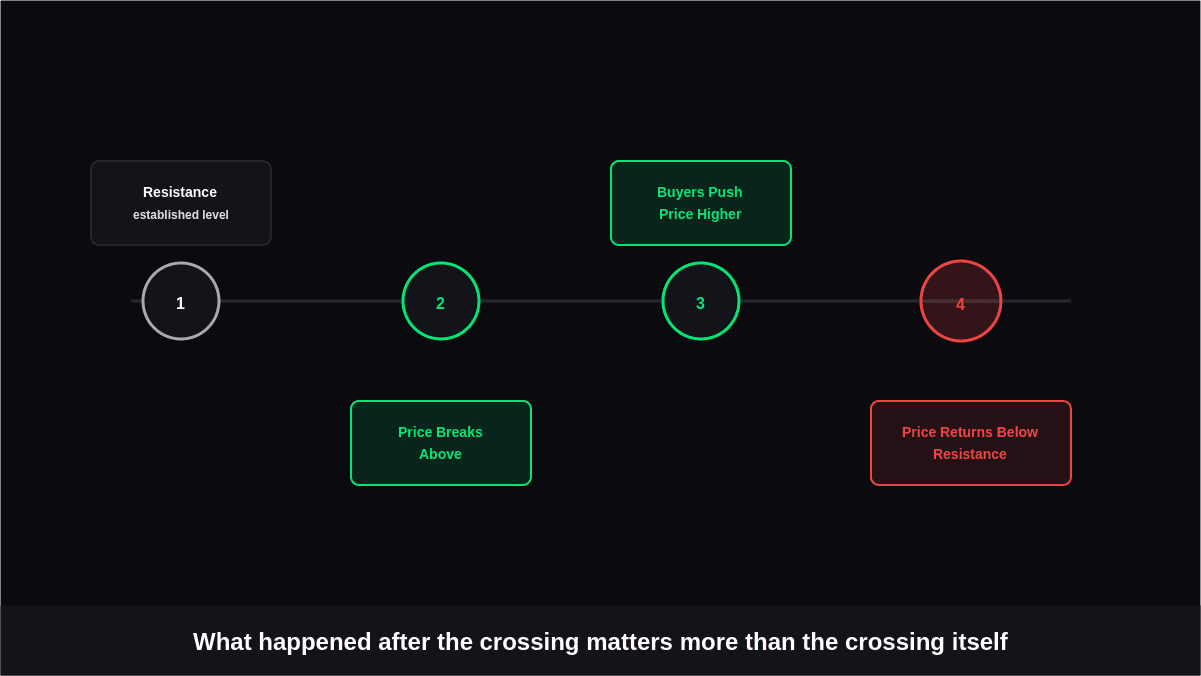
A failed breakout occurs when price moves beyond a significant boundary but cannot maintain the new position.
The sequence can look like this:
Resistance → price breaks above → buyers push price higher → price returns below resistance
The important observation is not simply that price crossed the level. It is what happened afterward.
Signals That Deserve Attention
Traders can examine:
- A rapid return inside the previous range
- Repeated rejection above the breakout area
- Declining follow-through
- Increased selling activity
- A close back below the original boundary
- Formation of a lower high after the failed move
The same principle applies to downside breaks. A move below support that quickly recovers the level may indicate that the initial breakdown did not produce sustained acceptance below support.
Where Does a Pullback Fit Into AIXI Price Action?
A pullback is different from a breakout.
A breakout describes price moving beyond an established boundary. A pullback describes a retracement that occurs after a prior directional movement.
For example:
Directional move → retracement → reaction near an important level
That sequence gives traders the context needed to determine whether a decline or rebound is actually a pullback.
What Traders Can Look For
When evaluating a potential AIXI pullback, traders can examine:
- The direction and strength of the preceding move
- The previous swing high or low
- Whether price is retracing toward a known support or resistance area
- How price behaves when it reaches that area
- Whether volume changes during the retracement
- Whether the original structure remains intact
A pullback should therefore not be confused with any temporary move in the opposite direction.
Why the Previous Move Matters
Consider a stock that rises from $1.20 to $1.60 and then falls to $1.48.
Calling the decline a pullback makes sense only because there was an identifiable preceding upward move.
If the same stock has been moving sideways between $1.40 and $1.50, a move from $1.50 to $1.45 may simply represent normal range movement rather than a meaningful pullback.
The surrounding structure determines the interpretation.
AIXI Range, Breakout and Pullback Compared
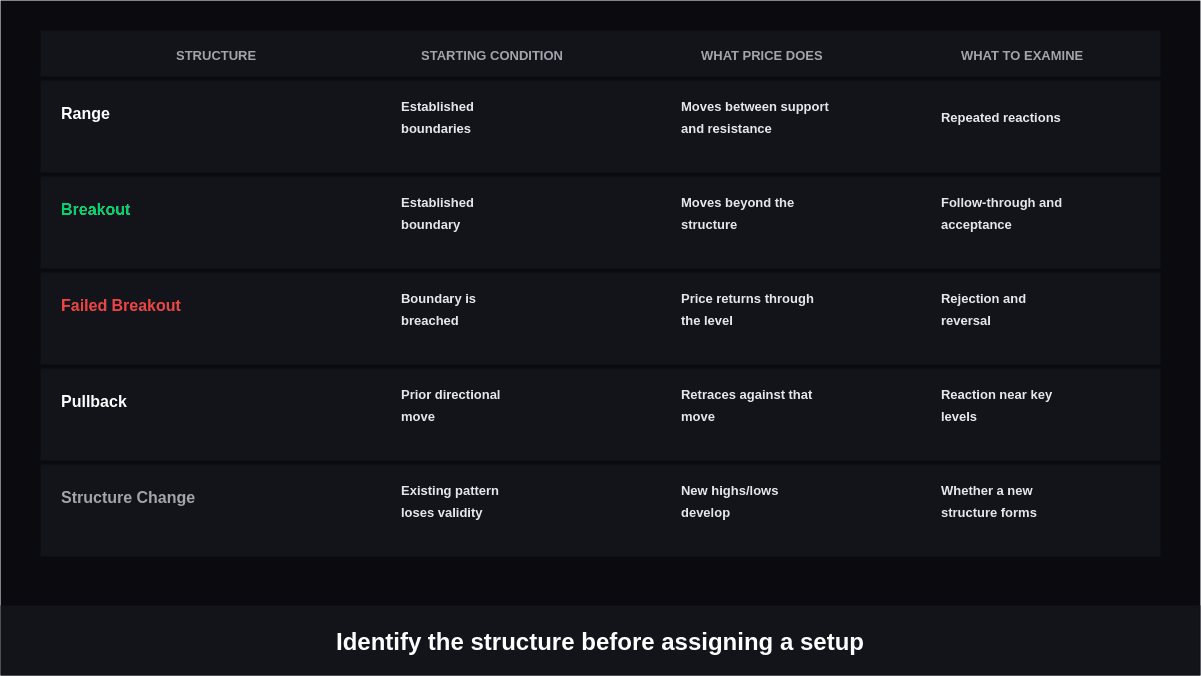
AIXI price action can take different forms as market conditions change, so each structure needs to be assessed on its own characteristics. The comparison below highlights what traders can look for when distinguishing a range, breakout, failed breakout, or pullback.
| Structure | Starting Condition | What Price Does | What Traders Examine |
|---|---|---|---|
| Range | Established boundaries | Moves between support and resistance | Repeated reactions |
| Breakout | Established boundary | Moves beyond the structure | Follow-through and acceptance |
| Failed Breakout | Boundary is breached | Price returns through the level | Rejection and reversal |
| Pullback | Prior directional move | Retraces against that move | Reaction near key levels |
| Structure Change | Existing pattern loses validity | New highs/lows develop | Whether a new structure forms |
These distinctions help prevent different price behaviors from being interpreted as the same setup. By identifying the underlying structure first, traders can better evaluate what AIXI price action is showing before considering a potential trade.
How Volume Adds Context to AIXI Technical Analysis
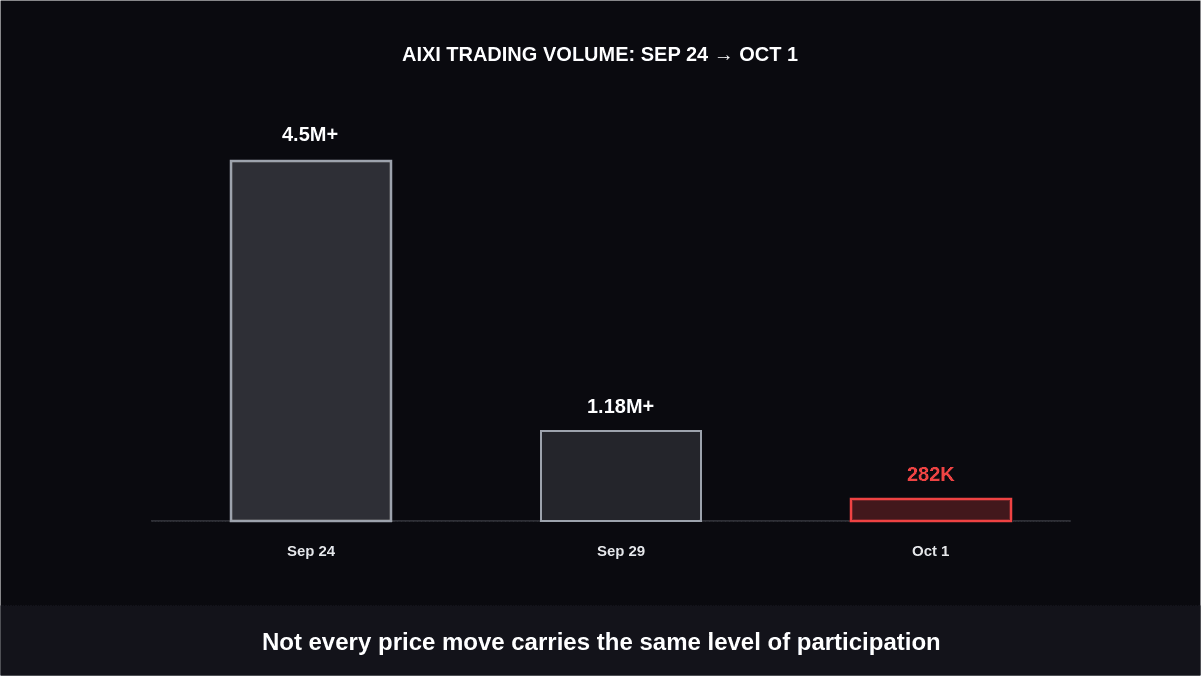
Price tells traders where the market moved. Volume can provide additional information about the level of participation accompanying that movement.
Recent AIXI data demonstrates why volume deserves attention. On September 24, the stock recorded more than 4.5 million shares traded, while October 1 recorded approximately 282,000 shares according to StockAnalysis. September 29 also recorded more than 1.18 million shares.
That variation means traders should avoid treating every price movement as equally significant.
Volume Questions to Ask
When reviewing AIXI trading activity, traders can ask:
- Did volume expand as price approached a key level?
- Did the breakout occur with greater participation?
- Did volume decline during a retracement?
- Was a major price move accompanied by unusually high activity?
- Did volume remain elevated after the initial move?
Volume does not independently confirm a trading setup. Instead, it adds another layer of context to the price structure.
What Recent AIXI Data Says About Its Structure
Recent historical data shows a sequence of declining closing prices across several sessions.
AIXI closed at:
- $2.04 on September 22
- $1.90 on September 23
- $1.88 on September 24
- $1.72 on September 25
- $1.60 on September 28
- $1.49 on September 29
- $1.39 on September 30
- $1.23 on October 1
This historical sequence is relevant because it demonstrates why traders should distinguish between the broader price path and shorter-term structures that may develop inside it.
A stock can move through a broader directional phase while still producing temporary ranges, failed breaks, and countertrend retracements along the way.
The latest October 1 session also traded between $1.18 and $1.33, providing a recent short-term range that traders can monitor for subsequent structural developments rather than assuming that it represents a confirmed new setup.
Key AIXI Price Areas Traders Can Monitor
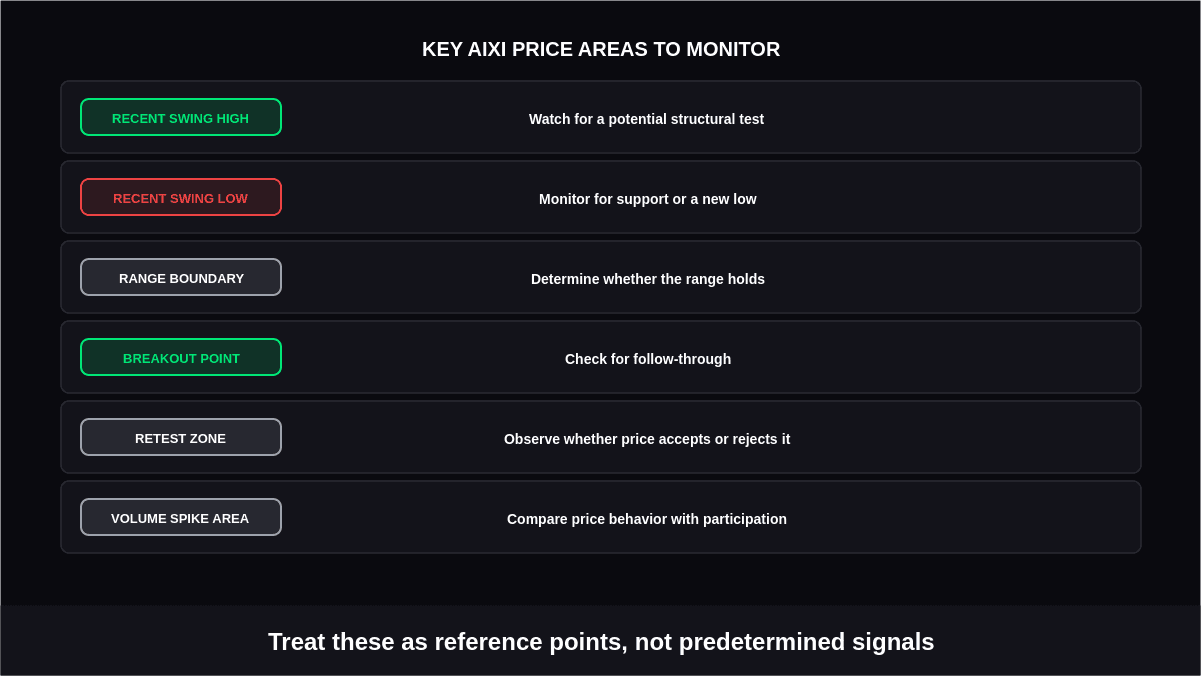
Rather than relying on fixed price targets, traders can map the chart using key structural reference points such as recent highs, lows, support, resistance, and potential breakout areas. These levels help provide context for understanding how AIXI price action develops.
| Price Area | What It Represents | How to Use It in Analysis |
|---|---|---|
| Recent swing high | Previous area of upward rejection | Watch for a potential structural test |
| Recent swing low | Previous area of downward pressure | Monitor for support or a new low |
| Range boundary | Repeated reaction area | Determine whether the range holds |
| Breakout point | Level where price leaves structure | Check for follow-through |
| Retest zone | Former boundary revisited | Observe whether price accepts or rejects it |
| Volume spike area | Session with unusually high activity | Compare price behavior with participation |
These levels are useful for understanding AIXI’s current price structure and identifying areas where market behavior may change. They should be treated as reference points for analysis rather than predictions or predetermined trading signals.
A Practical Framework for Reading AIXI Price Action
Traders can use a consistent process when reviewing the chart. Here you will a proper step by step guide for reading the AIXI price action:
Step 1: Start With the Higher-Timeframe Structure
Look at the daily chart before focusing on individual intraday candles.
Identify the major swing highs and lows first. This establishes the broader context in which shorter-term movements are occurring.
Step 2: Mark Established Levels
Look for areas where price has reacted multiple times.
A level supported by several reactions generally provides more structural information than a level created by one isolated candle.
Step 3: Determine Whether Price Is Inside or Outside the Structure
Ask whether price is:
- Inside an established range
- Testing a boundary
- Moving beyond a boundary
- Returning toward a previous level
- Creating new highs or lows
This classification helps prevent premature setup identification.
Step 4: Add Volume
Compare activity around the relevant price movement with recent sessions.
A major price move accompanied by a substantial change in volume deserves different scrutiny from a move occurring during relatively quiet trading.
Step 5: Watch What Happens Next
The next price reaction can provide important information.
- Does price hold the level?
- Does it immediately reverse?
- Does it establish another high or low?
- Does it return into the previous range?
This follow-up behavior can help determine whether the initial move represented a structural change.
What Could Change the AIXI Setup?
AIXI's structure can change quickly, particularly when price experiences large intraday ranges.
A range can develop after a directional move. A range can then produce a breakout attempt. That breakout can either hold or fail. A subsequent move back toward the breakout level can then create a potential pullback structure.
In other words, range, breakout, and pullback are not necessarily separate market environments. They can occur sequentially as the chart develops.
That is why a static label can become outdated quickly.
Traders reviewing AIXI should therefore update their analysis as new highs, lows, volume patterns, and reactions emerge rather than relying exclusively on an earlier chart interpretation.
AIXI Price Action Checklist
Before interpreting a new move, traders can work through this checklist:
- What is the most recent meaningful swing high?
- What is the most recent meaningful swing low?
- Is the price currently inside an established range?
- Has price actually moved beyond a structural boundary?
- Has the move held outside that boundary?
- Is there evidence of follow-through?
- Has trading volume changed?
- Is the move a continuation or a retracement?
- Where did the preceding move begin?
- Has the existing structure been invalidated?
This approach keeps the analysis focused on observable market behavior rather than assumptions about what price should do next.
Conclusion
AIXI price action currently offers several structural questions for traders to monitor rather than one setup that can be assumed in advance. Recent data shows a sequence of declining closes from $2.04 on September 22 to approximately $1.23 on October 1, alongside significant differences in daily trading volume.
The useful distinction is between what the chart has already established and what still needs confirmation.
A range requires repeated boundaries, a breakout requires movement beyond an established level followed by evidence that the move is holding, and a pullback requires a preceding directional move followed by a retracement.
For AIXI trading, this framework allows traders to monitor new price information without forcing the chart into a predetermined narrative.
As new sessions develop, changes in swing highs and lows, volume, support and resistance, and reactions around important levels can determine whether the existing structure remains relevant or needs to be reassessed.