To Analyze Trading Performance effectively, traders need to look beyond total profit or the number of winning trades. The amount of time a position remains open can reveal important patterns about how a strategy behaves. A setup may produce strong results during short holding periods but perform poorly when trades are kept open longer.
Trade duration provides another way to break down historical results and understand where a strategy has worked best. By grouping trades according to how long they remained active, traders can compare profitability, risk, consistency, and other useful backtesting metrics across different holding periods.
In this blog, we will explore what trading performance means, how trade duration affects performance analysis, and eight practical steps for evaluating results according to holding time.
What Is Trading Performance?
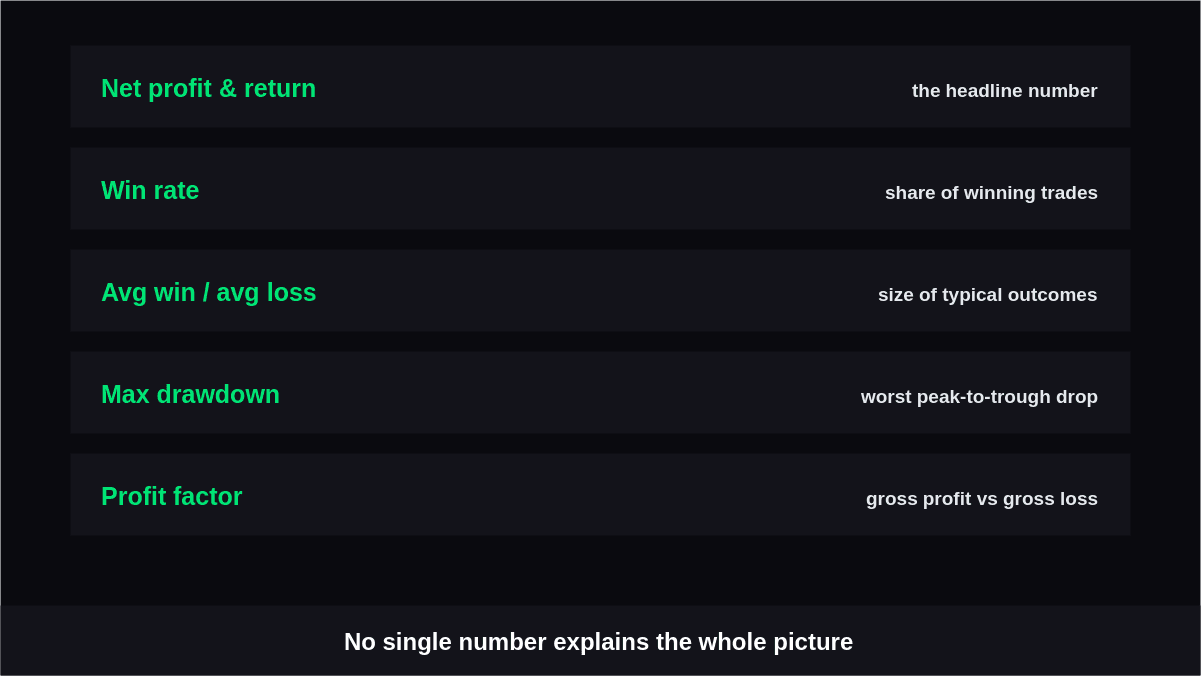
Trading performance refers to how effectively a trading strategy or trader produces results over a defined period. It is not limited to whether the account made money because profitability alone does not explain the risk or consistency behind those returns.
Useful Trading Performance Metrics can include:
- Net profit and percentage return
- Win rate
- Average winning and losing trade
- Maximum drawdown
- Profit factor
- Risk-adjusted return
- Number of trades
- Consistency across different market conditions
Looking at several measurements together gives a more complete picture than relying on one headline number.
What Does Trade Duration Mean?
Trade duration is the length of time between opening and closing a position. Depending on the strategy, it may range from seconds or minutes to several days, weeks, or longer.
For performance analysis, duration can be measured in:
- Seconds or minutes for very short-term trading
- Hours for intraday positions
- Trading days for swing strategies
- Weeks or months for longer-term approaches
The important point is to evaluate duration consistently across the entire trade history.
8 Steps to Analyze Trading Performance by Trade Duration
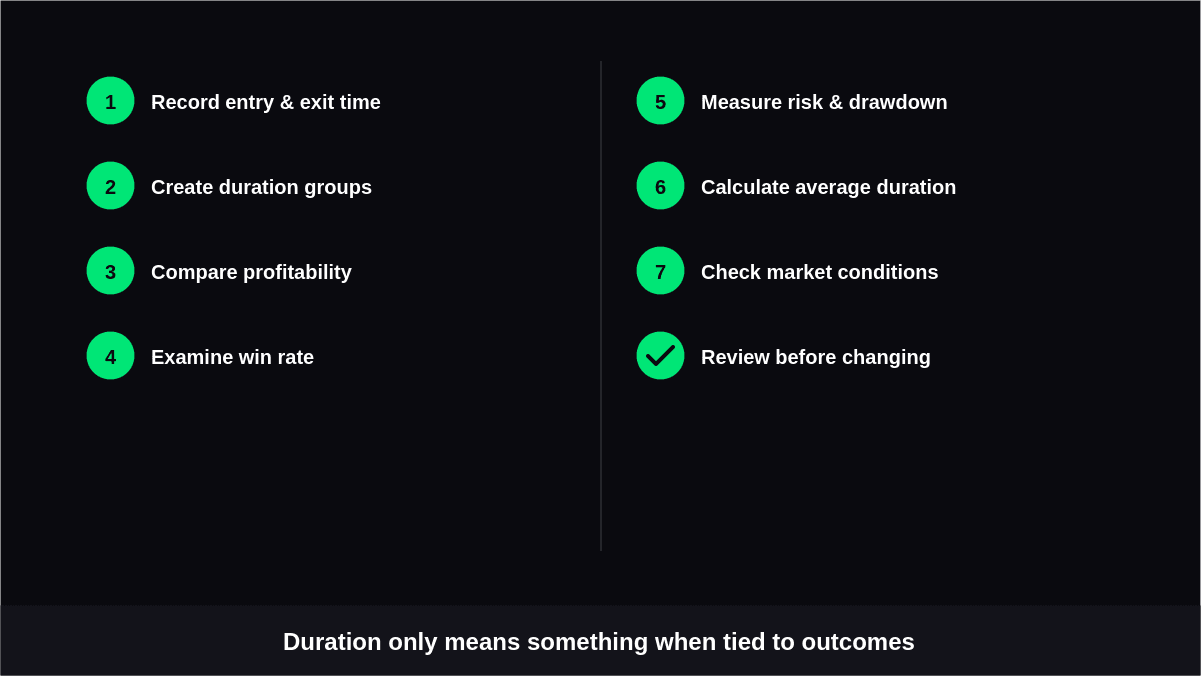
Trade duration becomes useful when it is connected to measurable outcomes rather than examined on its own.
The following process can help separate profitable holding periods from periods that may be contributing disproportionately to losses or risk.
1. Record the Entry and Exit Time for Every Trade
Start with reliable timestamps for every completed position. Without accurate opening and closing times, duration calculations can become inconsistent.
- Record the exact entry time.
- Record the exact exit time.
- Keep the same time zone throughout the dataset.
- Calculate the elapsed time for each completed trade.
- Separate open trades from completed trades.
This creates the foundation for comparing trades on a consistent basis.
2. Create Practical Duration Groups
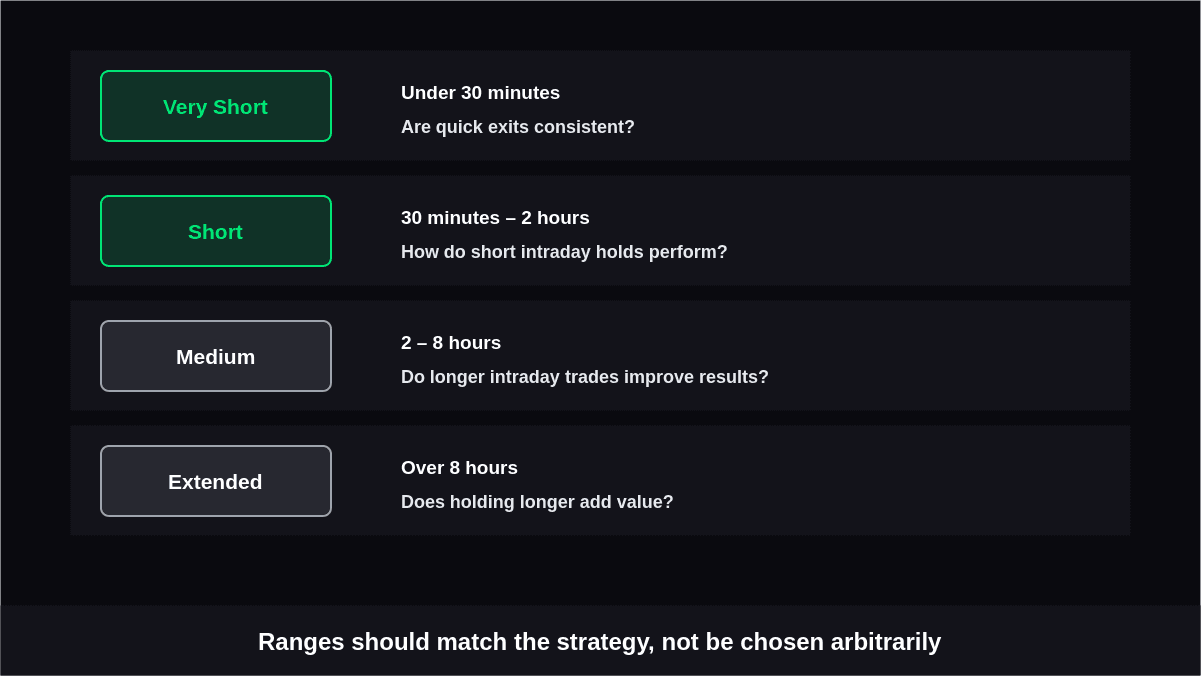
Individual durations can be difficult to interpret when every trade has a different holding period. Grouping trades into logical ranges makes patterns easier to identify.
For example:
| Duration Group | Holding Period | Useful Question |
|---|---|---|
| Very short | Under 30 minutes | Are quick exits producing consistent results? |
| Short | 30 minutes–2 hours | How does the strategy perform during short intraday holds? |
| Medium | 2–8 hours | Do longer intraday trades improve outcomes? |
| Extended | Over 8 hours | Does keeping positions open longer add value? |
The ranges should match the strategy rather than being chosen arbitrarily.
3. Compare Profitability Across Holding Periods
Once trades are grouped, calculate financial results for each category. This shows whether certain duration ranges have historically contributed more to overall returns.
- Calculate total profit or loss.
- Calculate average profit per trade.
- Compare winning and losing trades.
- Examine profit factor where appropriate.
- Note how many trades belong to each group.
A duration category with high total profit may simply contain more trades, so average results should be considered alongside aggregate performance.
4. Examine Win Rate Without Relying on It Alone
Win rate can reveal whether a particular holding period produces more successful trades, but it should not be treated as a complete performance measure.
For each duration group, review:
- Percentage of winning trades
- Percentage of losing trades
- Average winning trade
- Average losing trade
- Reward-to-risk characteristics
- Number of observations
A group with fewer winners can still be profitable if its winning trades are substantially larger than its losses.
5. Measure Risk and Drawdown by Duration
Profitability does not show how much risk was required to achieve an outcome. Duration analysis can therefore be combined with drawdown and loss measurements.
Consider:
- Largest loss within each duration group
- Average loss
- Maximum consecutive losses
- Drawdown contribution
- Volatility of individual trade returns
- Exposure time
This can reveal whether longer-held positions generate additional returns while also introducing larger downside swings.
6. Calculate the Average Trade Duration
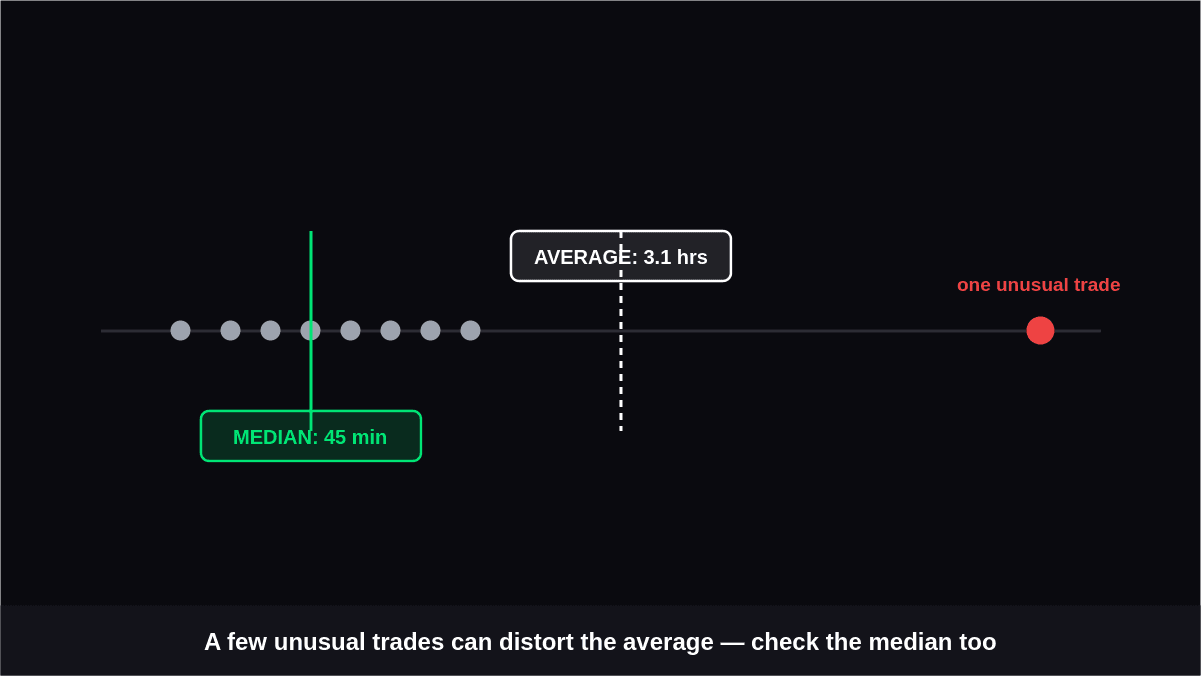
The Average Trade Duration provides a simple summary of how long positions typically remain open. However, the average should be interpreted alongside the distribution because a few unusually long trades can distort it.
Also examine:
- Median holding time
- Shortest trade
- Longest trade
- Duration range
- Distribution across duration groups
- Changes in duration over different periods
Comparing the average with the median can help identify whether unusually long or short trades are influencing the overall figure.
7. Check Performance Across Market Conditions
A duration that performs well in one environment may not produce the same results everywhere. Compare holding periods across different market conditions to determine whether the relationship is stable.
You can divide historical trades by:
- Trending markets
- Range-bound markets
- High-volatility periods
- Low-volatility periods
- Bullish and bearish phases
- Different market sessions
This prevents a trader from treating a duration pattern observed in one environment as a universal rule.
8. Review the Results Before Changing the Strategy
The final step is interpretation rather than immediate optimization. A duration pattern may identify an area worth investigating, but it does not automatically prove that changing the exit rules will improve future results.
Before making changes:
- Check whether the sample size is sufficient.
- Compare results across multiple periods.
- Look for unusually large individual trades.
- Account for transaction costs and slippage.
- Test any proposed adjustment on unseen data.
- Compare the revised approach with the original strategy.
The objective is to determine whether the observed relationship is persistent rather than simply a historical coincidence.
Why Trade Duration Adds Context to Performance Analysis
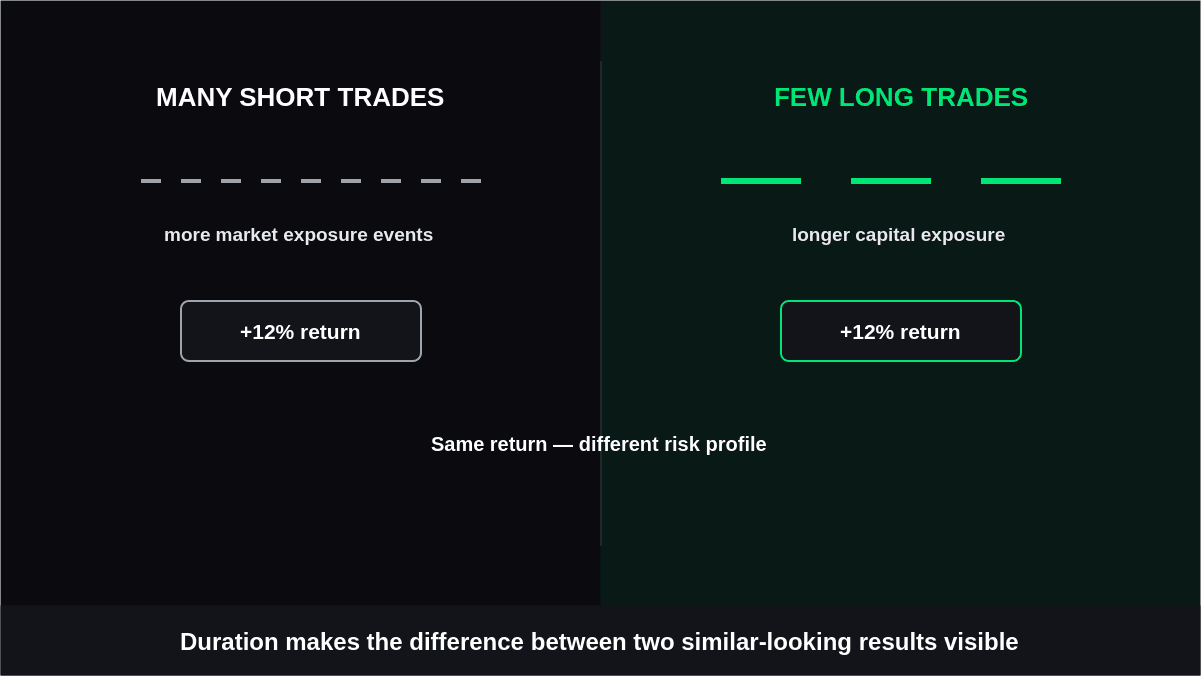
Trade duration helps connect Trading Performance Metrics with the time capital remains exposed to the market. Two strategies can produce similar returns while requiring very different holding periods, drawdowns, and levels of market exposure.
For example, a strategy producing a return through many short trades has a different operating profile from one achieving a similar result through fewer positions held for several days. Duration analysis helps make this distinction visible.
Conclusion
To Analyze Trading Performance by trade duration, traders should connect holding time with profitability, risk, consistency, and market conditions rather than treating duration as an isolated statistic.
Recording accurate timestamps, creating meaningful duration groups, comparing returns, evaluating risk, and testing patterns across different environments can reveal useful information about how to analyze backtest results and how a strategy actually behaves.
The analysis should ultimately support better evaluation of historical results, not encourage changes based on a single favorable pattern. A duration category that looks attractive in one dataset still needs sufficient observations and further testing before it becomes part of a trading process.