Trading decisions often involve more than watching price movements on a chart. Traders may use market analysis, technical tools, and defined strategies to identify potential opportunities, manage risk, and stay consistent with their approach. The right tools can also help organize market information and make chart analysis more structured.
The GainzAlgo V2 Alpha Trading Indicator is designed to provide traders with additional chart-based information they can consider alongside their existing analysis and trading plan.
Understanding GainzAlgo and Alpha Indicators
Before comparing different trading tools, it helps to understand what each one is designed to do. Traders use indicators to interpret price action, identify potential market conditions, and support decisions alongside their broader trading strategy.
What Is GainzAlgo?
GainzAlgo is a trading indicator designed to provide chart-based signals and market information that traders can use as part of their technical analysis. Rather than replacing a complete trading strategy, an indicator can serve as an additional input when evaluating potential entries, exits, and market direction.
What Are Alpha Indicators?
Alpha indicators generally refer to trading indicators or signal-based tools that aim to help traders identify potential opportunities by analyzing market data. Their features and methods can vary depending on the specific indicator, so traders should evaluate how an Alpha indicator generates signals, what markets it supports, and how it fits into their existing trading approach.
GainzAlgo V2 Alpha Features
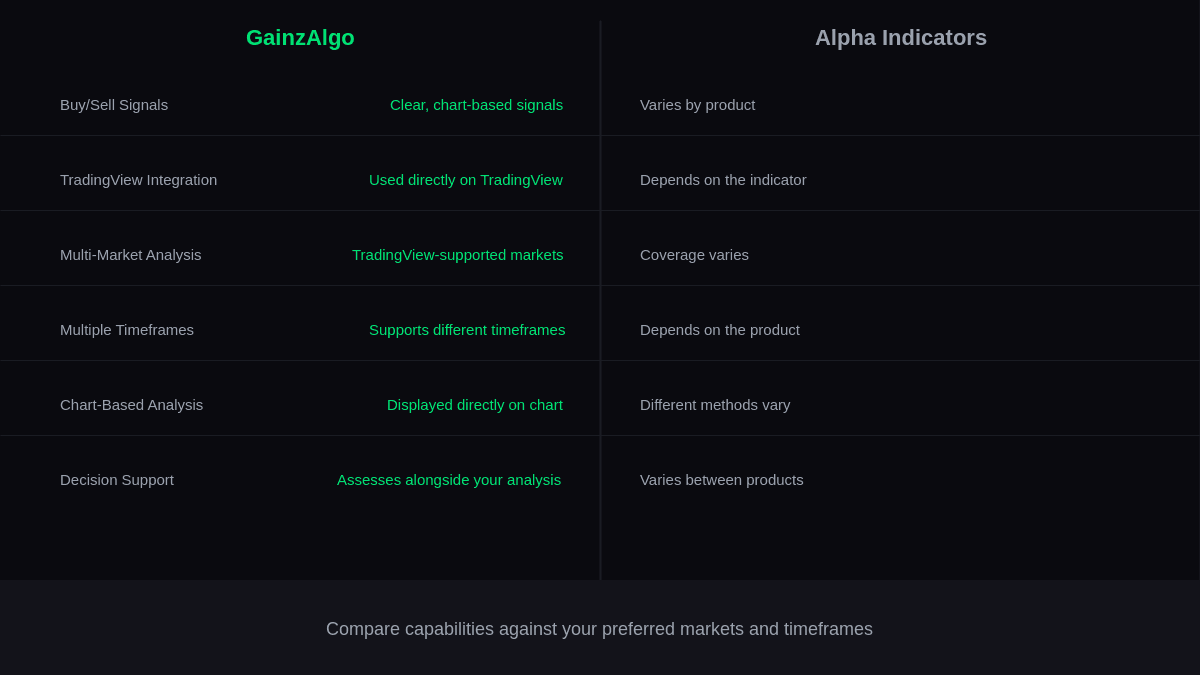
GainzAlgo and Alpha indicators can offer traders different features for analyzing the market. The table below highlights the key features of both to make the differences easier to understand.
| Feature | GainzAlgo | Alpha Indicators |
|---|---|---|
| Buy and Sell Signals | Provides clear buy and sell signals for chart-based market analysis. | Signal features vary depending on the specific Alpha indicator. |
| TradingView Integration | Can be used directly on TradingView charts. | Availability depends on the specific Alpha indicator. |
| Multi-Market Analysis | Can be applied across different TradingView-supported markets. | Market coverage varies by indicator. |
| Multiple Timeframes | Supports analysis across different chart timeframes. | Timeframe options depend on the specific indicator. |
| Chart-Based Analysis | Displays signals directly on the chart for easier market evaluation. | May use different chart-based signal and analysis methods. |
| Decision Support | Helps traders assess potential opportunities alongside their own analysis and strategy. | Use and decision-support features vary between Alpha indicators. |
Both can provide useful information for chart analysis, but their features and signal presentation may differ. Traders can compare these capabilities based on their preferred markets, timeframes, and overall trading approach.
What Markets Can You Use GainzAlgo and Alpha For?
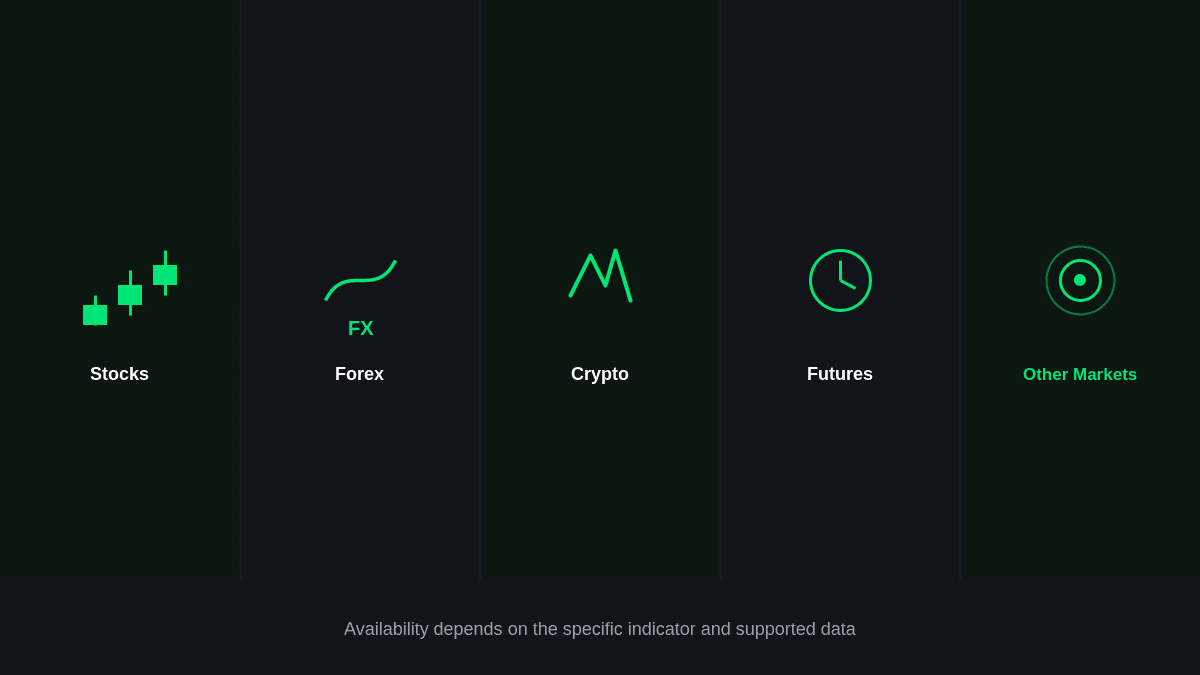
GainzAlgo and Alpha indicators can be used across different markets available through TradingView, depending on the specific indicator and supported chart data. Traders can explore their signals across stocks, forex, cryptocurrency, futures, and other supported instruments.
Stocks
Traders can use the indicators on stock charts to review potential signals alongside price action, trends, volume, and other market factors.
Forex
Forex traders can apply them to supported currency pairs and evaluate signals across different timeframes based on their trading approach.
Cryptocurrency
The indicators can also be used on cryptocurrency charts, where traders should consider the higher volatility and rapidly changing price conditions that can occur in crypto markets.
Futures
Traders can use supported futures charts to evaluate signals as part of their broader technical and market analysis.
Other TradingView Markets
Depending on the specific indicator and TradingView's available symbols and data, traders may also be able to use them across other supported markets and instruments.
GainzAlgo & Alpha Indicators: Key Differences
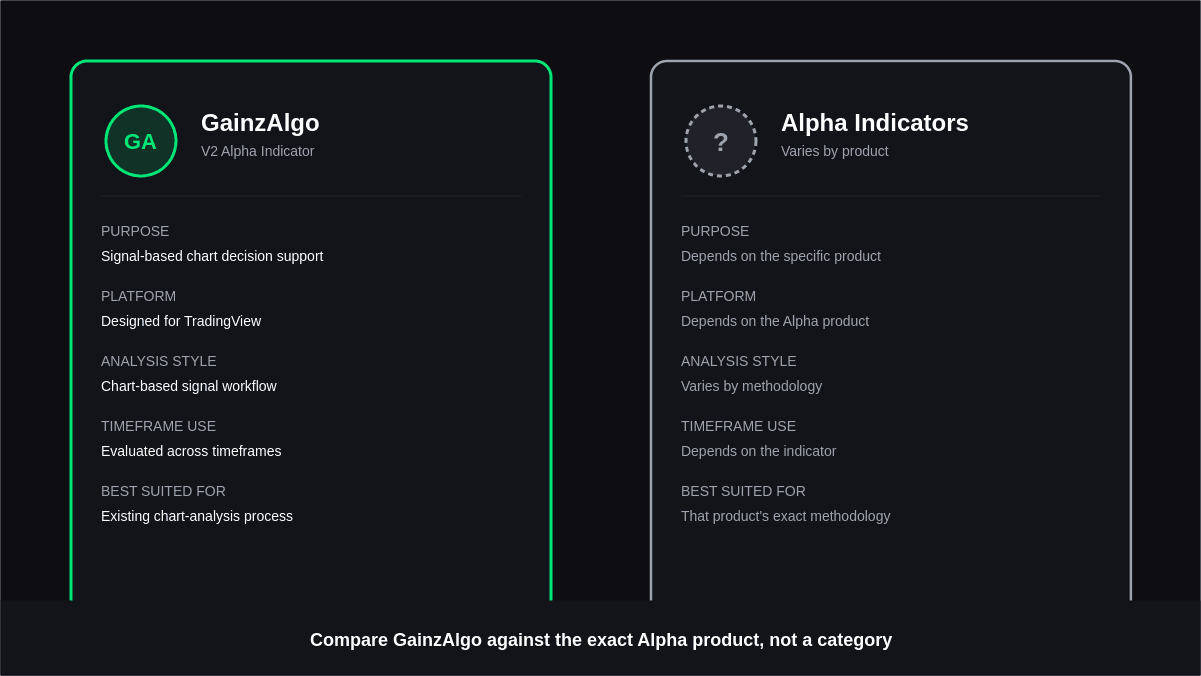
GainzAlgo and Alpha indicators can differ in how they generate signals, present market information, and fit into a trader's chart-analysis process. The comparison below highlights the main areas traders may want to consider before choosing between them.
| Feature | GainzAlgo | Alpha Indicators |
|---|---|---|
| Primary Purpose | Signal-based market analysis and chart-based decision support | Depends on the specific Alpha indicator and its intended use |
| Platform | Designed for use on TradingView | Depends on the specific Alpha product and supported platform |
| Analysis Style | Focuses on presenting signals within a chart-based workflow | Varies according to the indicator's methodology and features |
| Repainting | Traders should review documented behavior and conduct their own testing | Repainting behavior varies by the specific indicator |
| Best Suited For | Traders who want to incorporate signal-based information into their existing chart-analysis process | Traders whose preferred trading approach matches the features and methodology of the specific Alpha indicator |
| Timeframe Use | Signals can be evaluated across different timeframes | Timeframe support depends on the indicator |
The main difference is that GainzAlgo provides a defined signal-focused workflow, while Alpha indicators can refer to different tools with different features and methodologies. Traders should therefore compare GainzAlgo with the exact Alpha product they are considering rather than treating Alpha as one standardized indicator.
How GainzAlgo V2 Alpha Fits Into Your Trading Workflow
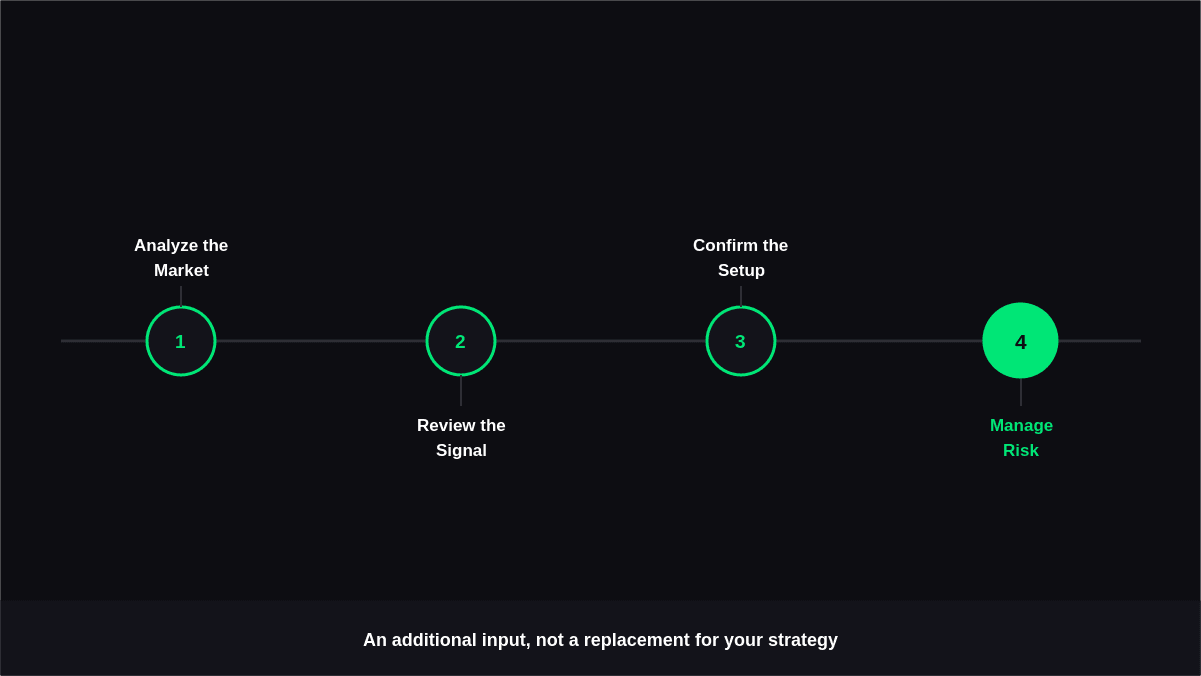
GainzAlgo V2 Alpha can be incorporated into a trading workflow as an additional analysis tool rather than a replacement for a trader's strategy. A structured process can help traders evaluate signals in the context of broader market conditions before deciding whether a setup is worth considering.
Analyze the Market
Start by reviewing the broader market picture, including price structure, trend direction, volatility, liquidity, and other factors that may influence the asset's current conditions.
Review the Signal
Once the market has been assessed, traders can review the GainzAlgo V2 Alpha signal as another piece of information. The signal can help draw attention to a potential setup, but it should not be treated as an automatic instruction to enter or exit a trade.
Confirm the Setup
Traders can then compare the signal with their own analysis. Price action, support and resistance, volume, trend conditions, and other technical tools may help determine whether the setup aligns with their trading strategy.
Manage Risk
Before entering a trade, traders should consider position size, stop-loss placement, potential risk, and the amount of capital they are willing to put at risk. This keeps risk management separate from the presence of any individual indicator signal.
Who Should Consider GainzAlgo?
GainzAlgo may be worth considering for traders who prefer a signal-based approach to chart analysis and want visible buy and sell signals within their TradingView workflow. It can suit traders who want to use indicator signals alongside price action, technical analysis, and their existing trading strategy.
Traders should also consider whether GainzAlgo fits their preferred markets, timeframes, analysis style, and risk-management approach before incorporating it into their routine.
Who Should Consider Alpha Indicators?
Alpha indicators may be worth considering when a trader prefers the specific methodology, features, or customization offered by a particular Alpha product. Different Alpha indicators can vary in how they generate signals, what markets they support, and how traders can configure them.
Because Alpha indicators are not a single standardized category, traders should evaluate the exact product they intend to use, including its signal logic, markets, timeframes, settings, and repainting behavior.
Which Fits Your Trading Style?
The better choice depends on how you prefer to analyze markets and how much you want an indicator to contribute to your trading process. Instead of choosing based only on features, consider your preferred signals, markets, timeframes, and overall strategy.
GainzAlgo May Fit Traders Who
- Prefer a signal-based TradingView workflow
- Want visible buy and sell signals directly on their charts
- Want to combine indicator signals with their own market analysis
- Trade across different markets or timeframes
- Prefer a structured process for reviewing potential setups
An Alpha Indicator May Fit Traders Who
- Prefer the methodology of a particular Alpha indicator
- Need specific features offered by that product
- Want a different approach to market analysis
- Already have a trading strategy built around that indicator's methodology
- Need functionality that is specific to the Alpha product they are considering
Ultimately, there is no single indicator that suits every trader. The right choice depends on your trading strategy, preferred market, timeframe, risk approach, and analysis process. Reviewing how an indicator fits into your existing workflow can help you make a more informed choice.
Do GainzAlgo and Alpha Indicators Repaint?
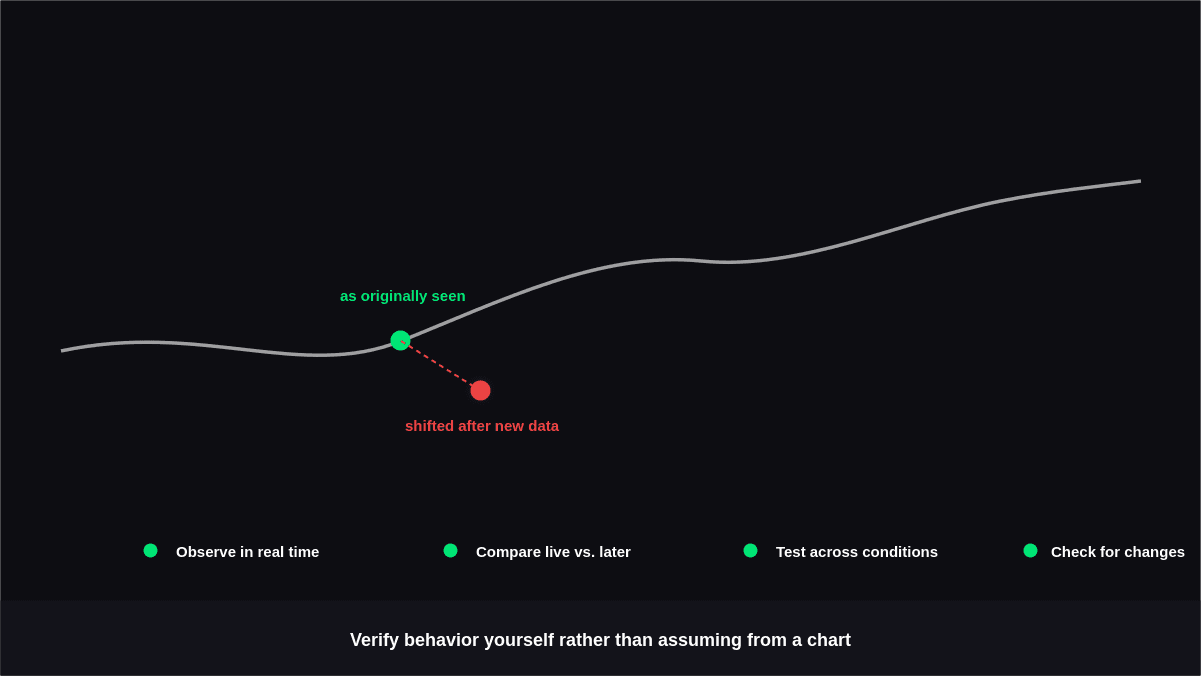
Repainting happens when an indicator's historical signals or values change after additional market data becomes available. This can make past signals look different from how they appeared in real time, so understanding repainting behavior is important when evaluating any trading indicator.
For GainzAlgo V2 Alpha, a definitive claim about non-repainting behavior should only be made when supported by product documentation or appropriate testing. Alpha indicators should also be evaluated individually because repainting behavior can vary between different products.
How to Evaluate Repainting
Traders can use the following checks to better understand how an indicator behaves:
- Observe signals in real time: Watch signals as they appear while new candles form.
- Compare live signals later: Review the same chart afterward and compare the historical signals with what was originally observed.
- Test different market conditions: Evaluate the indicator during trending, ranging, volatile, and calmer market periods.
- Check historical changes: Look for signals or values that move, disappear, or change after new candles form.
This approach gives traders a more reliable basis for evaluating an indicator than relying only on historical charts. Real-time observation and consistent testing can help provide a clearer picture of how signals behave under actual market conditions.
Make the Right Choice for Your Trading Workflow
GainzAlgo V2 Alpha and Alpha indicators can fit different trading approaches. Rather than choosing an indicator based only on signal frequency or past chart performance, consider its features, signal behavior, supported markets, timeframes, and how well it fits into your overall trading process.