Trading results can look very different depending on the period being measured. A strategy may produce strong returns over one month but show weaker performance over a full year because market conditions, volatility, trade frequency, and risk exposure change over time.
Looking at only one period can therefore create an incomplete picture of how a strategy has actually performed.
Comparing trading results across multiple periods gives traders a broader view of consistency, profitability, drawdowns, and risk. Instead of focusing on a single winning or losing stretch, traders can identify whether performance remains reliable across different market environments and time horizons, making backtesting vs. forward testing an important consideration when evaluating consistency.
In this blog, we will explore:
- What different trading periods mean
- How trading performance can vary by period
- How to calculate trading results
- Seven practical steps for comparing results across different periods
- Common questions about period-based performance analysis
What Does Different Periods Mean in Trading?
Different periods refer to specific time ranges used to evaluate trading activity and performance. These can range from a single trading session to several years.
The purpose of using multiple periods is not simply to find the period with the highest return. Instead, each timeframe provides a different perspective on how a strategy behaves, helping traders separate temporary performance from longer-term patterns.
Trading Different Periods
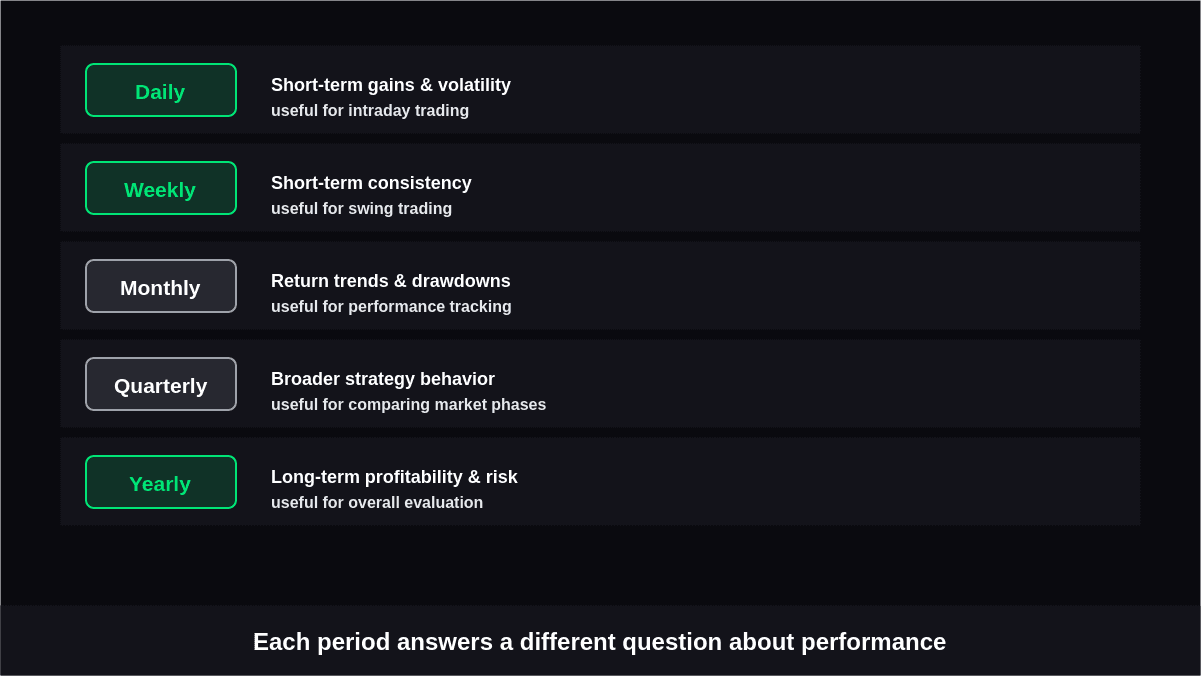
A trader can divide historical trading data into standardized periods such as daily, weekly, monthly, quarterly, and yearly intervals. The appropriate period depends on the strategy, trading frequency, and purpose of the analysis.
| Trading Period | What It Shows | Useful For |
|---|---|---|
| Daily | Short-term gains, losses, and volatility | Intraday and active strategies |
| Weekly | Short-term consistency and trade distribution | Swing trading and weekly reviews |
| Monthly | Return trends and drawdowns | Performance tracking |
| Quarterly | Broader strategy behavior | Comparing market phases |
| Yearly | Long-term profitability and risk | Overall strategy evaluation |
Using several periods prevents one unusually strong or weak stretch from dominating the analysis.
For example, a profitable month may not indicate sustainable performance if the strategy struggles consistently during the rest of the year.
How Can You Calculate Trading Results?
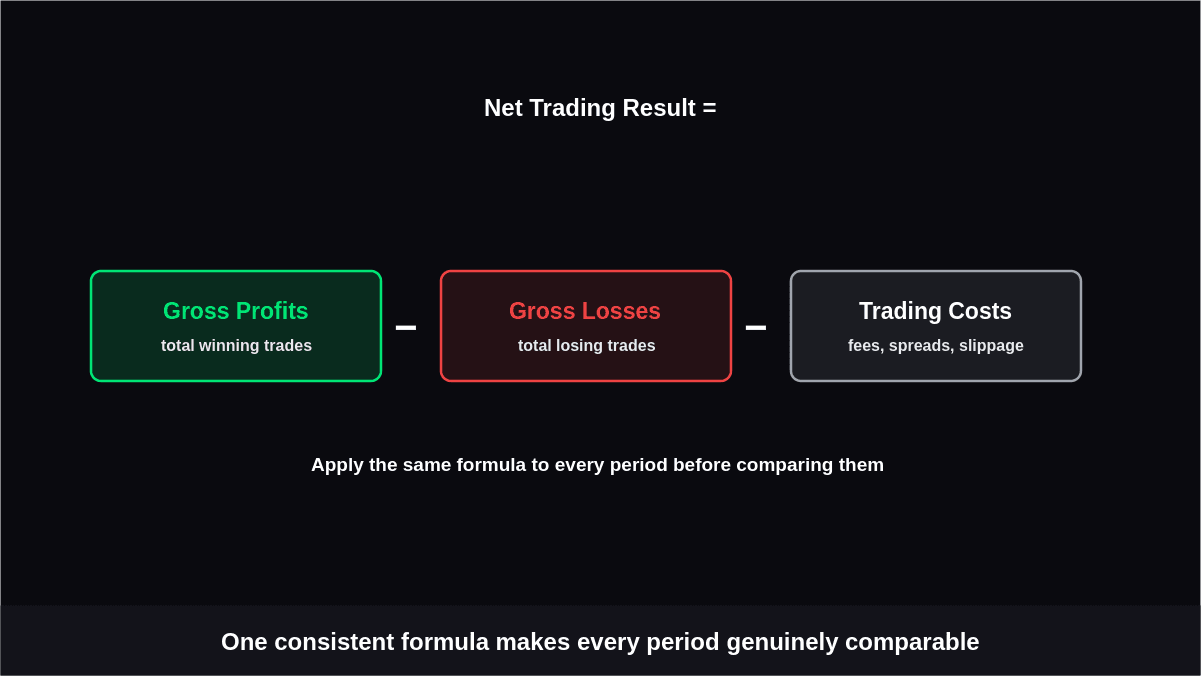
Calculating trading results starts with determining the net outcome of all completed trades during a selected period. A basic calculation subtracts total losses and trading costs from total gains.
Net Trading Result = Gross Profits − Gross Losses − Trading Costs
For more useful analysis, traders should also calculate percentage returns, win rate, average profit per trade, maximum drawdown, and other risk-related measures. Using the same calculations for every period makes comparisons more meaningful.
7 Steps to Compare Trading Results Across Different Periods
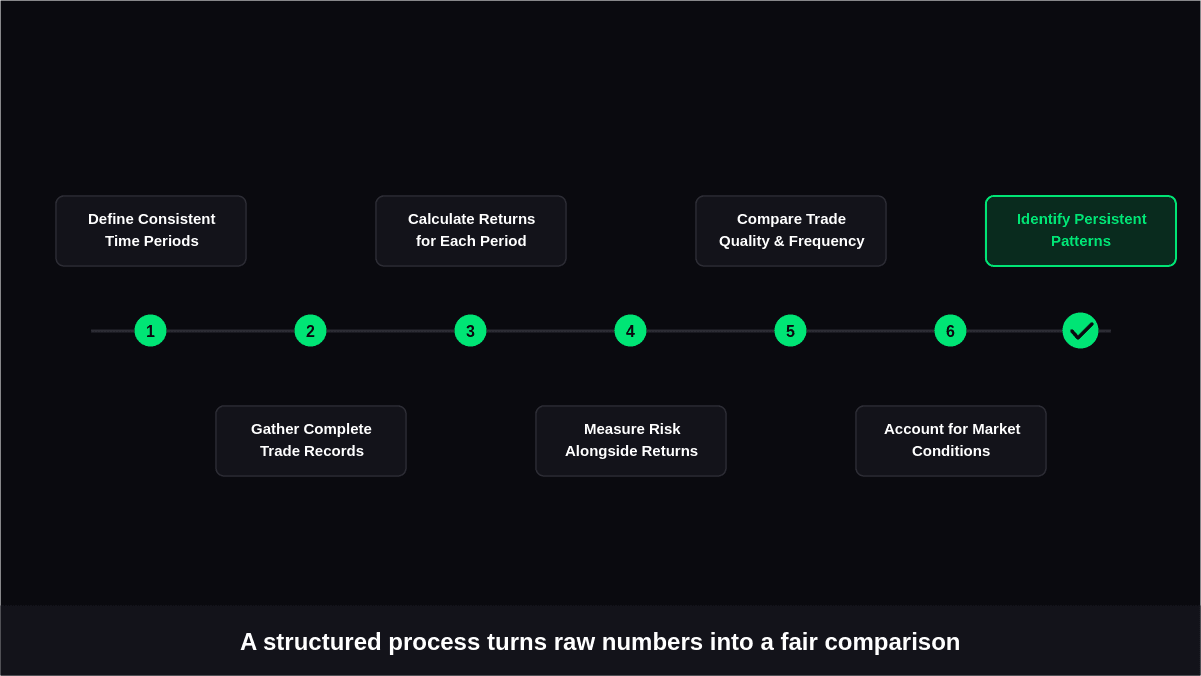
Comparing periods effectively requires more than placing monthly or yearly returns next to each other. Traders should use consistent measurements, account for risk, and investigate why results changed.
1. Define Consistent Time Periods
Start by deciding which periods will be compared. The intervals should be clearly defined and applied consistently throughout the dataset.
- Use fixed calendar periods where appropriate.
- Avoid mixing arbitrary time ranges.
- Ensure each period contains enough trading activity for meaningful analysis.
- Match the timeframe to the strategy being evaluated.
A day-to-day strategy may require daily and weekly comparisons, while a longer-term strategy may benefit more from monthly, quarterly, and yearly periods.
2. Gather Complete Trade Records
Accurate comparison depends on having reliable trade information for every selected period. Missing transactions can distort both returns and risk measurements.
Record details such as:
- Entry and exit prices
- Position size
- Trade dates and times
- Realized profit or loss
- Commissions and other trading costs
- Trade direction
Organizing these records allows traders to calculate each period using the same underlying information.
3. Calculate Returns for Each Period
Once the data is organized, calculate the return generated during each interval. Percentage returns are particularly useful because they make periods easier to compare when account balances or capital allocations differ.
Consider:
- Net profit or loss
- Percentage return
- Starting and ending account value
- Capital deployed
- Trading costs
A period with a larger dollar profit is not automatically stronger if substantially more capital was required to generate it.
4. Measure Risk Alongside Returns
Returns alone cannot show how difficult a period was to trade. Two periods may produce similar profits while having very different levels of risk.
Include measures such as:
- Maximum drawdown
- Volatility
- Largest losing trade
- Losing streaks
- Risk-adjusted return
This helps distinguish profitable periods achieved with controlled exposure from those that depended on substantially higher risk.
5. Compare Trade Quality and Frequency
The number and characteristics of trades can explain why results changed between periods. A high-return month may have contained many small opportunities, while another period may have generated only a few larger trades.
Review:
- Number of trades
- Win rate
- Average winning trade
- Average losing trade
- Profit factor
- Average trade duration
This analysis helps identify whether performance came from frequent opportunities, larger individual gains, improved trade selection, or another measurable factor.
6. Account for Market Conditions
Market conditions can significantly influence strategy behavior. A system designed for strong trends may perform differently during sideways markets, while volatility-sensitive strategies can react differently when price movement expands or contracts.
Compare periods based on characteristics such as:
- Trend direction
- Volatility levels
- Major market events
- Liquidity conditions
- Strength or weakness across the traded asset
Connecting performance with market conditions provides context that raw returns cannot provide by themselves.
7. Identify Persistent Patterns
The final step is to determine which observations continue to appear across multiple periods. The goal is to distinguish repeatable behavior from isolated results.
Look for:
- Consistent profitability
- Recurring drawdown patterns
- Similar win-rate ranges
- Periods of performance deterioration
- Changes in trade frequency
- Repeated strengths or weaknesses under specific conditions
A pattern that appears across several independent periods deserves more attention than an outcome seen only once.
Why Period Comparisons Matter for Strategy Evaluation
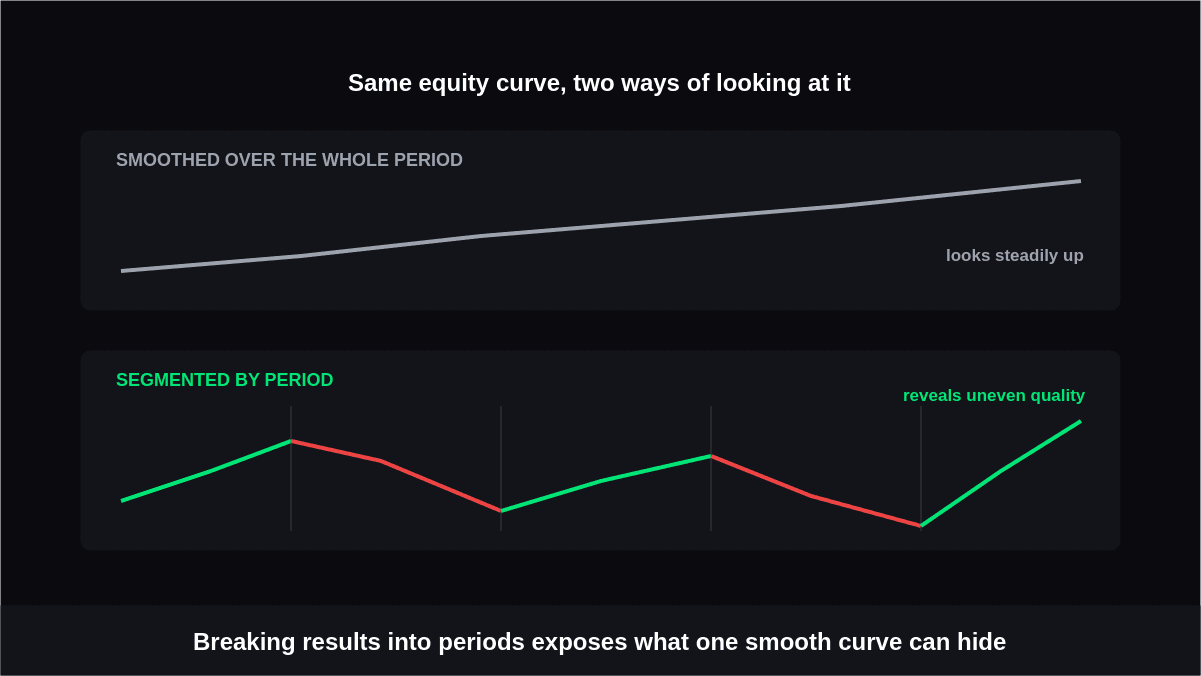
Period-based analysis can reveal changes that are hidden by an overall performance figure. For example, a strategy may show positive cumulative returns while experiencing gradually increasing drawdowns or declining trade quality.
Breaking performance into separate intervals makes these changes easier to investigate. It also allows traders to determine whether a strategy's behavior has remained relatively stable or shifted over time.
Common Mistakes When Comparing Trading Periods
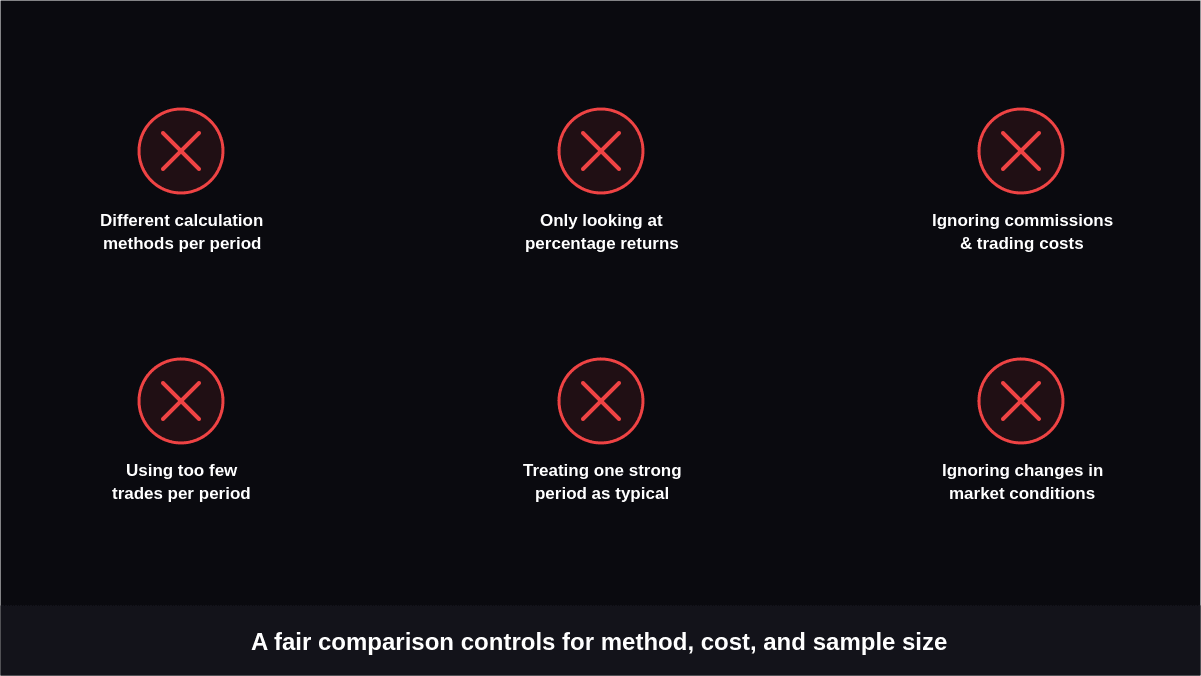
Even a well-organized comparison can become misleading if the measurements are inconsistent.
- Comparing periods with different calculation methods
- Looking only at percentage returns
- Ignoring commissions and trading costs
- Using too few trades in a comparison
- Treating an unusually strong period as representative
- Ignoring changes in market conditions
- Comparing raw profits without considering capital or risk
A useful comparison should evaluate both the outcome and the conditions under which that outcome was produced.
Conclusion
Comparing trading results across different periods gives traders a clearer understanding of how a strategy behaves over time. Daily, weekly, monthly, quarterly, and yearly analysis can reveal changes in profitability, drawdown, trade frequency, and consistency that may remain hidden in an overall account figure.
The most useful approach combines standardized periods with consistent calculations and risk measurements. By reviewing returns alongside trade characteristics and market conditions, traders can use backtesting metrics to build a more complete trading performance analysis and identify patterns worth investigating further.