A trading strategy may produce impressive results in a historical backtest, yet struggle when it encounters market data it has never seen before.
One possible reason is data snooping, a problem that can occur when researchers repeatedly test ideas, change parameters, or compare different strategies using the same dataset until a favorable result emerges.
In such cases, the apparent edge may be the result of chance rather than a pattern that is likely to persist.
The risk becomes greater in quantitative trading, where a single dataset can be used to test countless combinations of indicators, entry conditions, exit rules, timeframes, and parameters.
If researchers focus only on the best-performing result, they may unintentionally select a strategy that fits historical noise instead of identifying a robust relationship.
This makes avoiding overfitting trading strategy an important part of evaluating whether a strategy can perform beyond the data used during development.
The following methods can help traders and researchers build more reliable backtests and assess whether a strategy has genuine potential.
What Is Data Snooping in Trading Research?
Data Snooping occurs when historical market data is used so extensively to develop, modify, and select a trading strategy that the final result becomes influenced by the dataset itself.
For example, a researcher might test dozens of technical indicators across several timeframes and markets. After finding one combination with an unusually high historical return, they may continue adjusting its parameters until the results improve further.
If the final strategy is selected primarily because it performed well on the same historical sample, its apparent edge may be partly the product of repeated testing.
The core problem is selection bias within the research process. A strategy can fit historical noise particularly well without capturing a relationship that persists in future markets.
Data Snooping can arise through several activities:
- Testing many strategy variations and reporting only the strongest result
- Repeatedly changing parameters after reviewing backtest performance
- Trying numerous indicators until one produces attractive historical results
- Using the same dataset for development and final validation
- Selecting favorable assets or periods after seeing the results
- Discarding unsuccessful experiments without accounting for them
The more opportunities researchers give themselves to search through historical data, the greater the possibility of finding an impressive result by chance.
5 Ways to Prevent Data Snooping in Trading Research
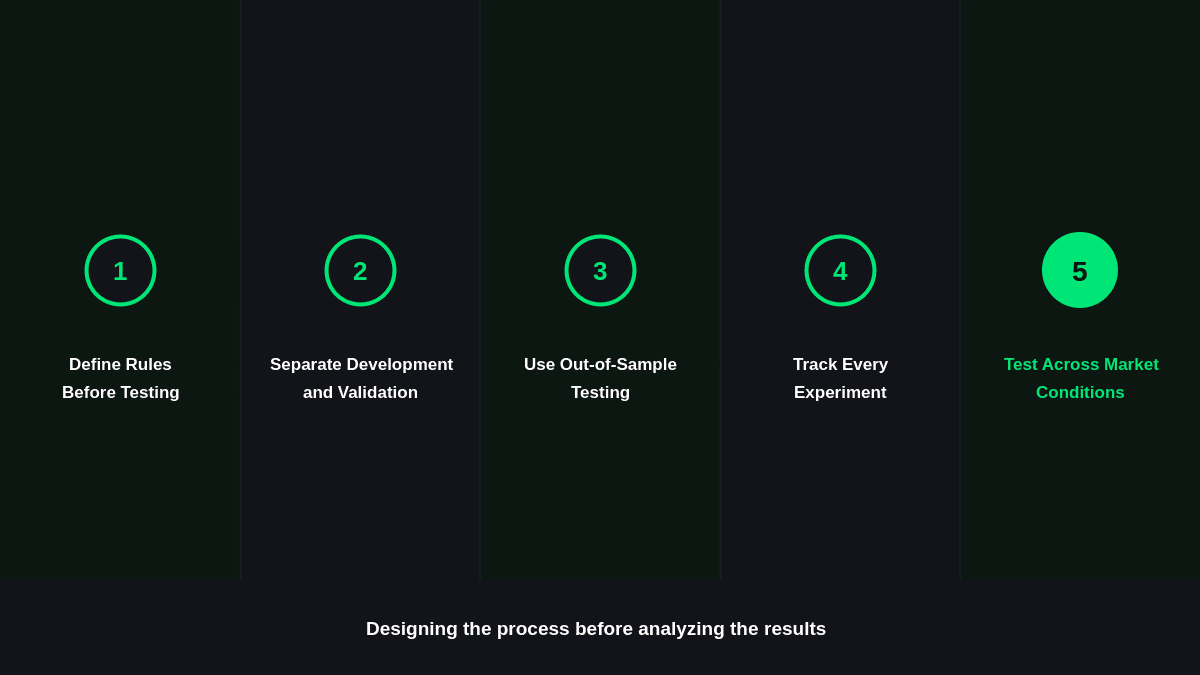
Preventing Data Snooping starts with designing the research process before analyzing the results. Each method below addresses a different source of bias.
1. Define the Research Rules Before Testing
Write down the hypothesis, variables, testing period, performance measures, and acceptable modifications before running extensive experiments.
For example, instead of testing every possible moving-average combination, establish a specific hypothesis about why a particular relationship should exist. This creates a clear research question and reduces the temptation to keep changing the methodology whenever an unfavorable result appears.
Predefined rules also make it easier to distinguish a genuine hypothesis test from an exploration that was shaped by previous results.
2. Separate Development Data From Validation Data
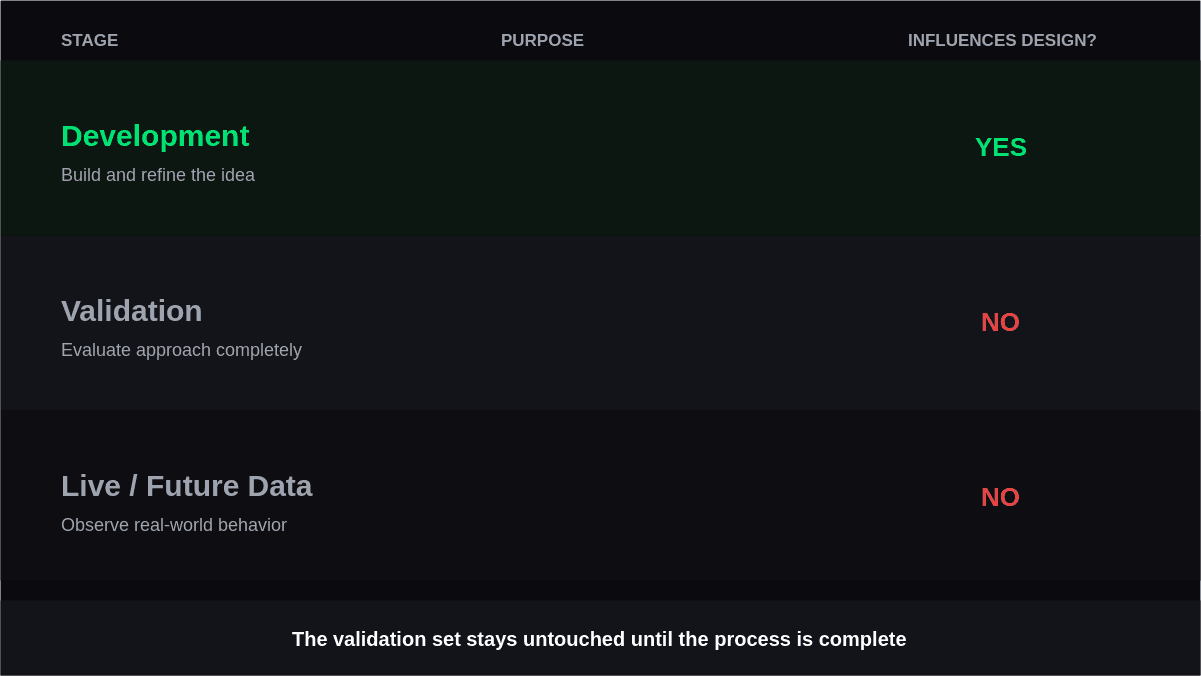
Divide the available historical sample into different roles. One portion can be used to develop the strategy, while another remains untouched until the research process is complete.
This creates a stronger test of whether the strategy can work beyond the observations used to build it. The validation dataset should not influence parameter selection or strategy design before its formal evaluation.
A simple structure might look like this:
| Research Stage | Purpose | Should Influence Strategy Design? |
|---|---|---|
| Development sample | Build and refine the idea | Yes |
| Validation sample | Evaluate approach completely | No |
| Live or future data | Observe real-world behavior | No |
The exact split depends on the research design, dataset size, and trading frequency.
3. Use Out-of-Sample Testing
Out-of-sample testing evaluates a strategy using observations that were not involved in its development. It provides a more realistic indication of how the strategy handles unfamiliar market conditions.
For instance, a researcher could develop a strategy using earlier years and reserve later years for evaluation.
The important principle is that the reserved period remains unseen during development.
A strong out-of-sample result does not prove that a strategy will remain profitable. However, a significant deterioration from development results can reveal that the original performance was heavily dependent on the historical sample.
4. Track Every Experiment
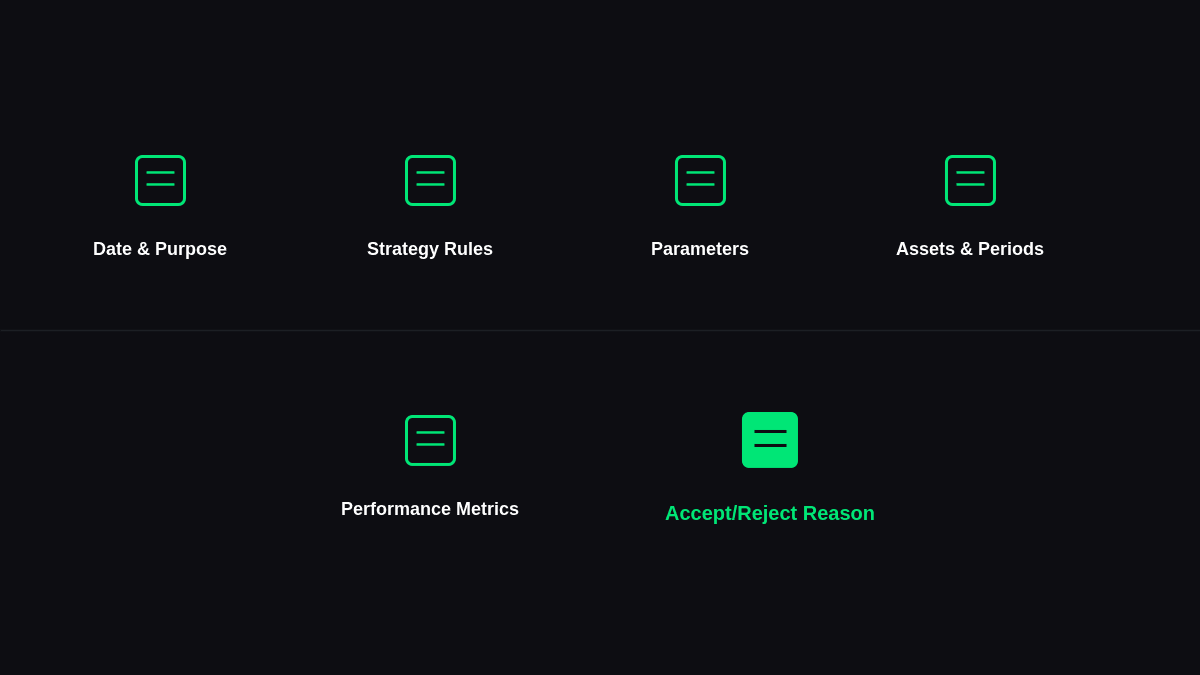
Keep a research log containing the strategies, parameter combinations, datasets, and results that were tested.
This step is often overlooked because unsuccessful experiments may seem irrelevant. They are not. If hundreds of alternatives were examined before one attractive strategy was selected, that history provides important context for interpreting the final result.
A research log can include:
- Date and purpose of each experiment
- Strategy rules tested
- Parameters examined
- Assets and time periods used
- Performance metrics
- Reason for accepting or rejecting a variation
Documenting the full process makes selective reporting less likely and provides a clearer picture of how much searching occurred.
5. Test Across Different Market Conditions
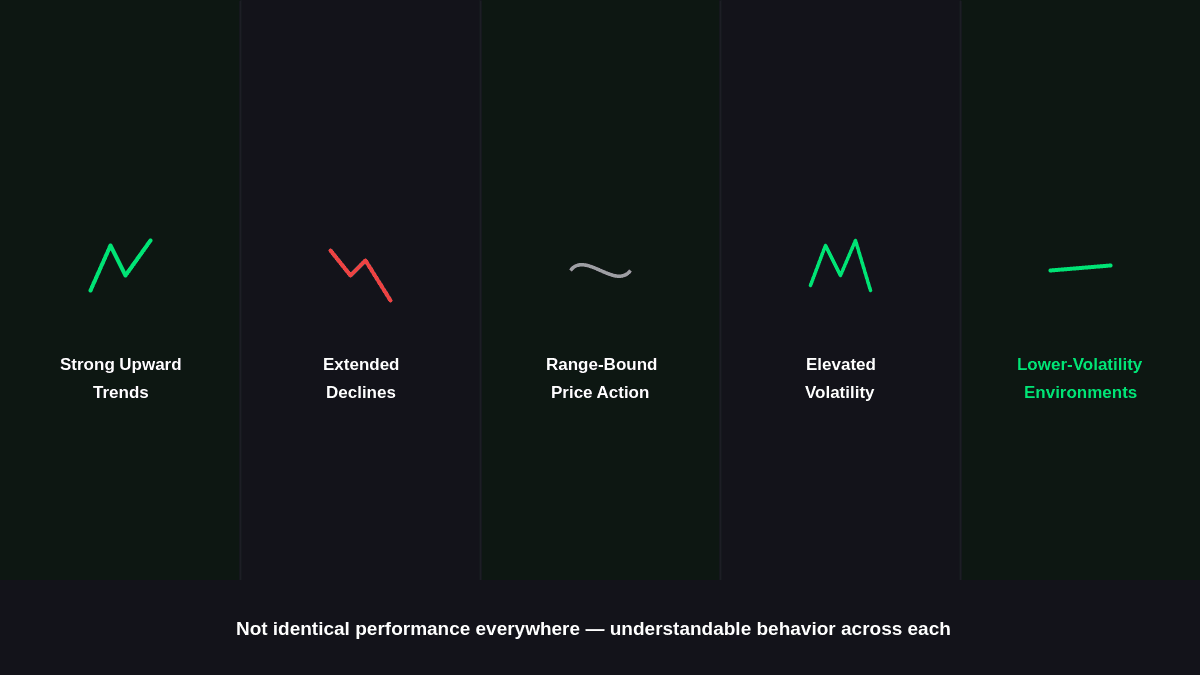
A strategy that works during one particular market environment may not represent a durable relationship. Researchers should examine whether the underlying behavior remains observable across different conditions.
This can include periods with:
- Strong upward trends
- Extended declines
- Range-bound price action
- Elevated volatility
- Lower-volatility environments
The goal is not to force a strategy to perform identically everywhere. Instead, researchers can determine whether its behavior changes for understandable reasons and whether its results depend heavily on one unusual period.
Data Snooping vs Reliable Trading Research
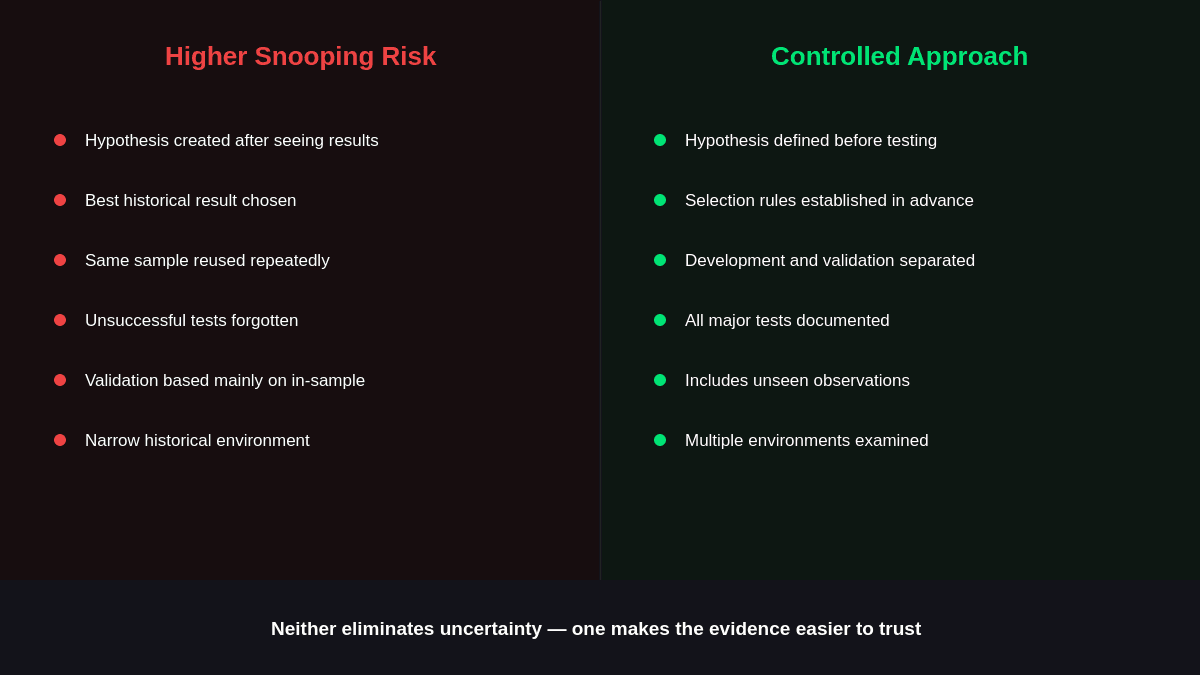
The distinction becomes clearer when comparing uncontrolled experimentation with a structured research process.
| Area | Higher Snooping Risk | More Controlled Approach |
|---|---|---|
| Hypothesis | Created after seeing results | Defined before testing |
| Strategy selection | Best historical result chosen | Selection rules established in advance |
| Data usage | Same sample repeatedly reused | Development and validation separated |
| Experiments | Unsuccessful tests forgotten | All major tests documented |
| Validation | Based mainly on in-sample results | Includes unseen observations |
| Market conditions | Narrow historical environment | Multiple environments examined |
This does not eliminate uncertainty. Even a carefully designed process can produce false discoveries. The purpose is to reduce avoidable sources of optimism and make the evidence easier to interpret.
Conclusion
Data Snooping can make a trading strategy appear more reliable than the underlying evidence supports. Repeated experimentation, selective strategy selection, and excessive parameter adjustments can cause historical noise to become embedded in the final model.
A more disciplined research process separates development from validation, defines hypotheses in advance, and evaluates strategies across different market environments. In-sample vs out-of-sample testing helps distinguish development data from unseen data used for validation.