Market structure helps traders understand how price is behaving instead of relying on individual signals in isolation. To Read Market Structure, traders need to examine swing points, trend direction, breaks in price behavior, and the relationship between recent highs and lows.
GainzAlgo charts can add another layer of information by displaying buy and sell signals alongside the price action, helping traders study where potential market opportunities appear.
Rather than treating every signal as an automatic entry, traders can use the chart to understand the context behind a setup. GainzAlgo provides signals across different markets and timeframes, while its V2 presets can also display take-profit and stop-loss levels.
Combining these chart elements with signals and overlays and an understanding of price structure can make market analysis more organized and easier to review.
In this blog, we will explore how market structure works, what traders should observe on a chart, and five practical steps for reading structure with GainzAlgo.
What Is Market Structure?
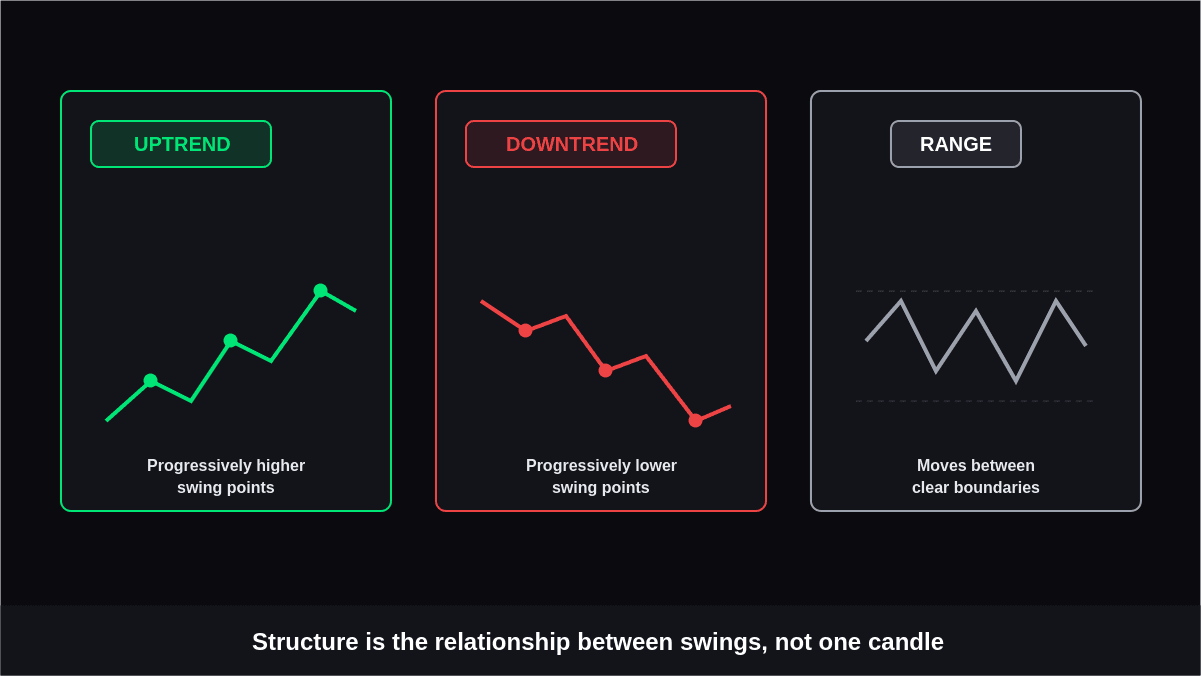
Market structure describes the way price forms successive highs, lows, and directional movements over a selected timeframe. These movements provide clues about whether buyers or sellers are currently exerting greater pressure.
A market generally develops through three broad conditions:
- Uptrend: Price forms progressively higher swing points.
- Downtrend: Price creates progressively lower swing points.
- Range: Price moves between recognizable boundaries without establishing a sustained directional trend.
The important point is that structure is based on the relationship between price movements, not simply whether a candle is bullish or bearish. A single strong candle may attract attention, but the surrounding swing points provide the broader context.
What to Know When Reading Market Structure
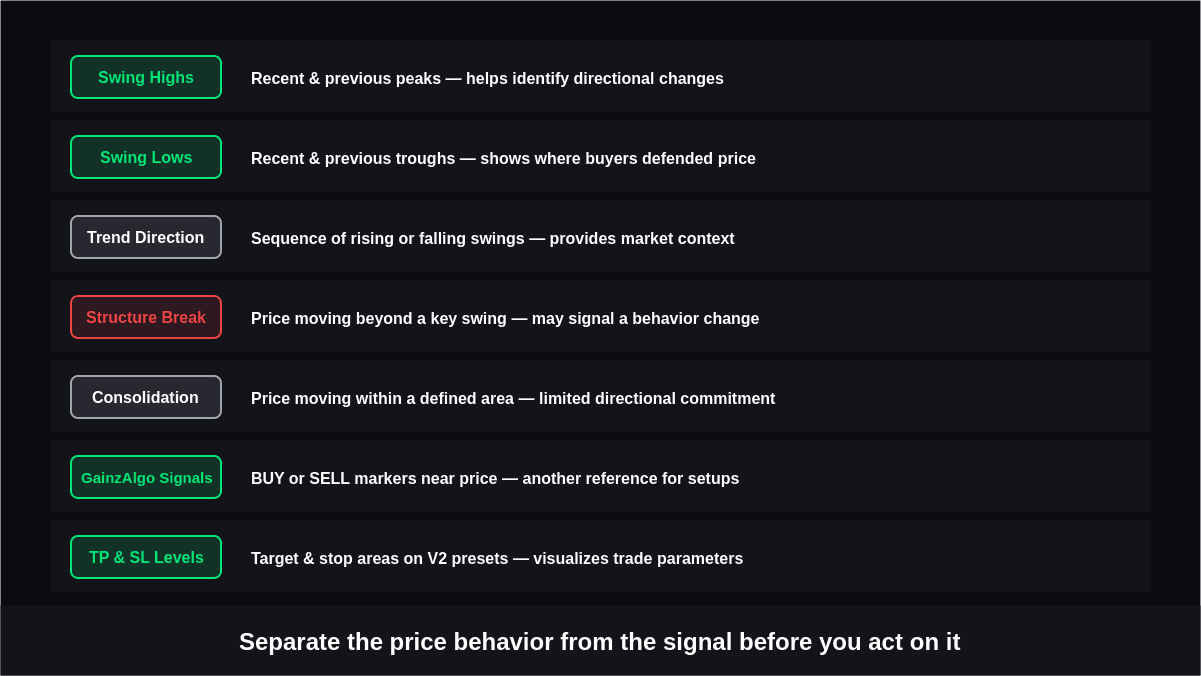
Before analyzing a GainzAlgo chart, traders should establish the timeframe and identify the most meaningful price swings.
Very small movements can create noise, particularly on lower timeframes, while larger swings may provide a clearer view of the prevailing direction.
| Market Structure Element | What to Look For | Why It Matters |
|---|---|---|
| Swing Highs | Recent and previous price peaks | Helps identify directional changes |
| Swing Lows | Recent and previous price troughs | Shows where buyers previously defended price |
| Trend Direction | Sequence of rising or falling swings | Provides broader market context |
| Structure Break | Price moving beyond an important swing | May indicate a change in market behavior |
| Consolidation | Price moving within a defined area | Shows limited directional commitment |
| GainzAlgo Signals | BUY or SELL markers near price action | Adds another reference for evaluating setups |
| TP & SL Levels | Suggested target and stop-loss areas on V2 presets | Helps visualize potential trade parameters |
This approach is useful for Market Structure Analysis because it separates the underlying price behavior from individual signals. Traders can then examine whether a GainzAlgo signal appears within a developing trend, after a structural change, or during consolidation.
5 Steps to Read Market Structure Using GainzAlgo Charts
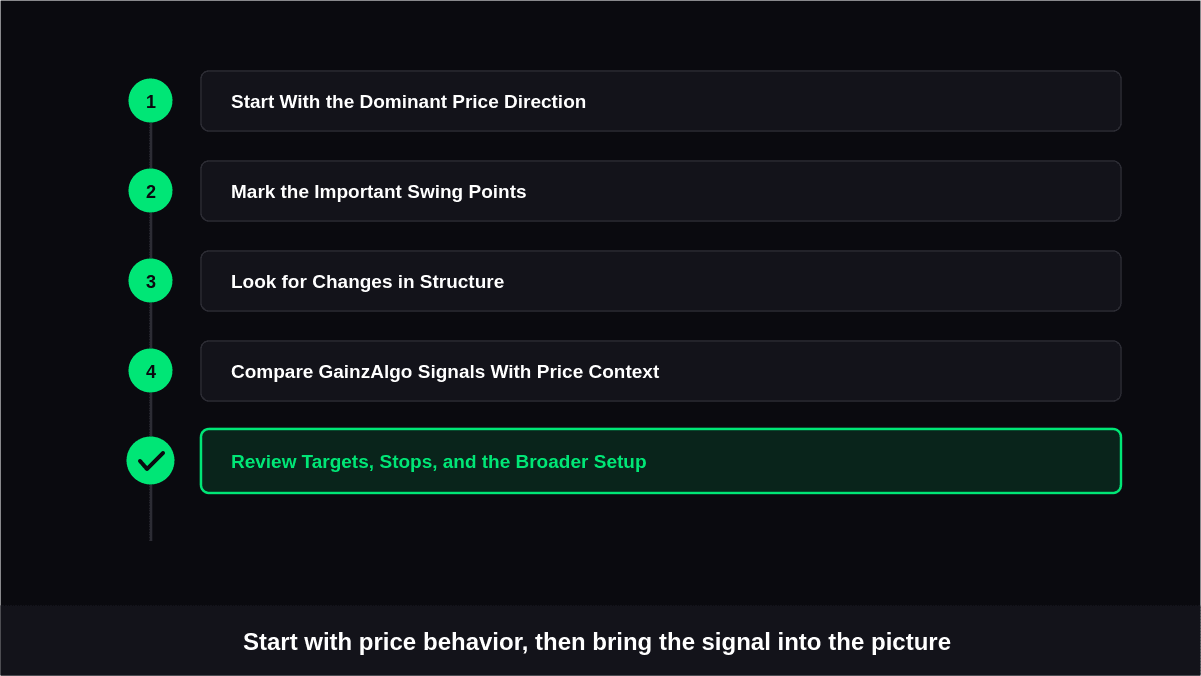
Reading structure becomes more practical when the process follows a consistent sequence. Instead of starting with a BUY or SELL marker, begin with price behavior and gradually bring the GainzAlgo information into the analysis.
1. Start With the Dominant Price Direction
First, zoom out enough to understand what price has been doing across the selected timeframe.
- Look for a sequence of rising or falling swing points.
- Determine whether the market is trending or moving sideways.
- Avoid defining the trend from one or two candles alone.
- Compare recent price action with the broader movement visible on the chart.
For example, a series of rising swing highs and swing lows can indicate that buyers have maintained directional control. A sequence of declining swings may show the opposite behavior.
2. Mark the Important Swing Points
Once the broad direction is visible, focus on the highs and lows that have clearly influenced subsequent price movement.
- Identify prominent recent highs and lows.
- Give greater attention to swings followed by meaningful price movement.
- Avoid treating every minor fluctuation as a major structural point.
- Compare current swings with earlier ones on the same timeframe.
This is where Higher Highs and Lower Lows become particularly useful. A consistent sequence can help traders distinguish a developing trend from temporary price movement.
3. Look for Changes in Structure
After identifying the key swings, examine whether price continues to respect the existing pattern or begins to challenge it.
- Watch for prices moving beyond a significant previous swing.
- Check whether the move is followed by sustained price action.
- Compare the break with the surrounding market context.
- Be cautious about interpreting a brief intrabar move as a confirmed structural change.
A structural shift does not automatically mean that a complete reversal has occurred. It can instead signal that the existing market behavior deserves closer examination.
4. Compare GainzAlgo Signals With Price Context
Now bring the GainzAlgo signals into the analysis rather than using them as the starting point.
- Check where a BUY signal appears relative to recent swing lows and highs.
- Examine whether a SELL signal occurs during an established decline, near a resistance area, or after an extended move.
- Consider the timeframe on which the signal appears.
- Review whether the surrounding price structure supports or conflicts with the signal.
This step helps prevent a common mistake: treating every indicator signal as independent of market conditions. A signal becomes more informative when traders understand what price was doing when it appeared.
5. Review Targets, Stops, and the Broader Setup
For GainzAlgo V2 presets that provide TP and SL levels, traders can use those levels as part of the final chart review.
- Examine the distance between the potential entry and stop-loss level.
- Consider whether the target area is realistic within the current structure.
- Look for nearby swing points that could affect the trade.
- Check whether the setup still makes sense across the selected timeframe.
Traders can also consider Support and Resistance when reviewing these areas. Previous reaction zones may influence how price behaves after a signal, making them useful reference points when evaluating the overall setup.
Why Timeframe Context Matters
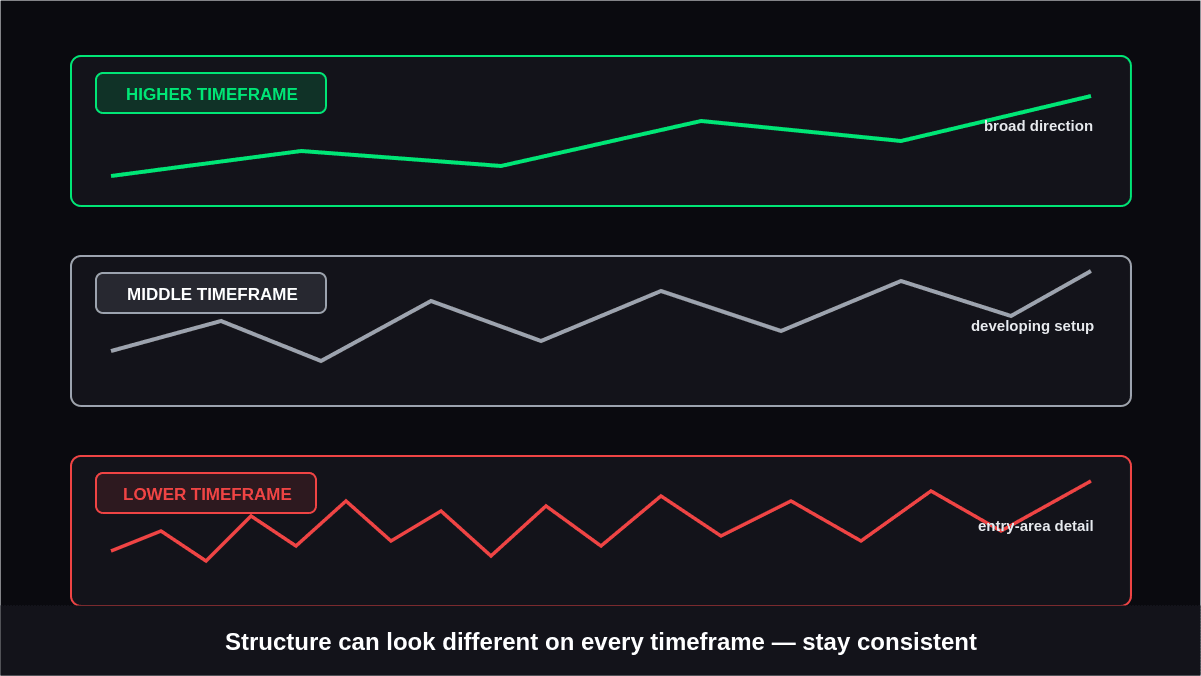
Market structure can look completely different depending on the timeframe being analyzed. A chart may show a short-term decline while the broader timeframe remains in an established uptrend.
Using multiple timeframes can therefore provide additional context:
- A higher timeframe can show the broader directional environment.
- A middle timeframe can help identify the developing setup.
- A lower timeframe can reveal shorter-term price movements around an entry area.
GainzAlgo supports different markets and timeframes, allowing traders to examine signals within the timeframe that matches their trading approach. The important part is maintaining consistency rather than switching timeframes simply to find a more favorable signal.
Common Mistakes When Reading Structure
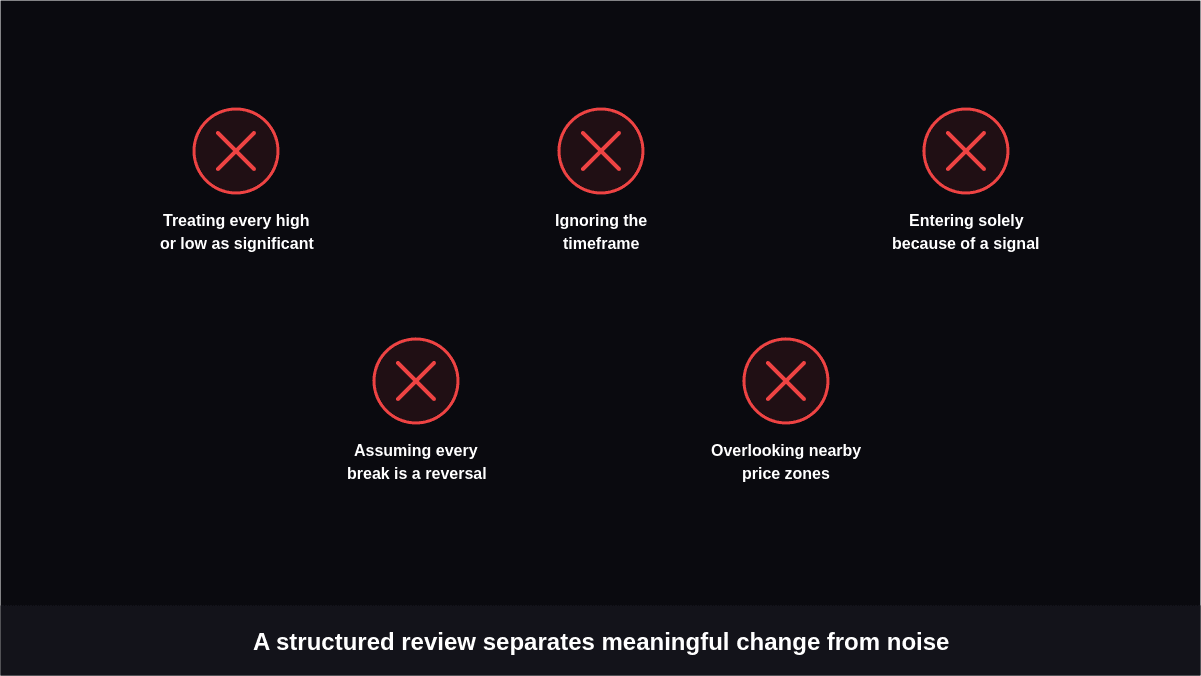
Even a clear chart can be misinterpreted when traders focus too narrowly on individual movements.
- Treating every high or low as significant: Minor fluctuations can create unnecessary noise.
- Ignoring the timeframe: Structure on a five-minute chart may differ substantially from the daily chart.
- Entering solely because of a signal: A BUY or SELL marker should be considered within its surrounding price context.
- Assuming every break is a reversal: A temporary move beyond a swing does not always establish a new trend.
- Overlooking nearby price zones: Previous reaction areas can affect how a setup develops.
A structured review can help traders distinguish meaningful changes from short-lived price movements.
Conclusion
To read market structure effectively with GainzAlgo charts, traders need to look beyond individual BUY and SELL signals and understand how price is developing around them. Swing highs, swing lows, structural breaks, trend direction, and important reaction areas all contribute to a clearer interpretation of the chart.
GainzAlgo can provide additional chart information through its signals and, with V2 presets, TP and SL levels. These features can support a structured review, but they do not remove the need to evaluate the surrounding market conditions.
By identifying the broader direction first, examining meaningful swings, checking market structure, comparing signals with price behavior, and reviewing the complete setup, traders can approach chart analysis with a more consistent process.