The IREN breakout setup has attracted attention after a sharp September recovery pushed the stock from a September 1 close of $36.82 to an intramonth high of $49.37 on September 23.
The move has since cooled, with IREN closing at $44.13 on September 25, leaving traders watching whether the recent advance can regain its momentum or whether the stock needs to establish another base first.
Recent price action makes IREN an interesting chart to monitor because the stock has established several clearly visible reaction zones within a relatively short period.
Rather than treating one price as a guaranteed breakout point, traders can use those areas to build scenarios around confirmation, failed moves, support, resistance, and invalidation while applying price action concepts to assess the setup.
In this blog, we will examine the recent IREN chart, identify the levels that matter most, explain what could confirm a breakout, and outline the conditions that would weaken the current setup.
Why IREN's Recent Chart Caught Our Attention
The recent move stands out because IREN advanced from $36.82 on September 1 to $49.37 on September 23, a substantial move within the month. Several consecutive sessions produced higher closes during the first half of September, while September 18 alone saw the stock rise 7.36% to $46.68.
However, the move has not yet produced a clean continuation above the recent high. IREN fell from $48.55 on September 22 to $47.05 on September 23 and then $46.15 on September 24 before closing at $44.13 on September 25.
That sequence makes the $49 area particularly important when evaluating the next potential breakout attempt.
The broader context also matters. IREN's 52-week range currently extends from $28.93 to $76.87, showing how much volatility the stock has experienced over the past year.
IREN Support and Resistance Levels to Watch
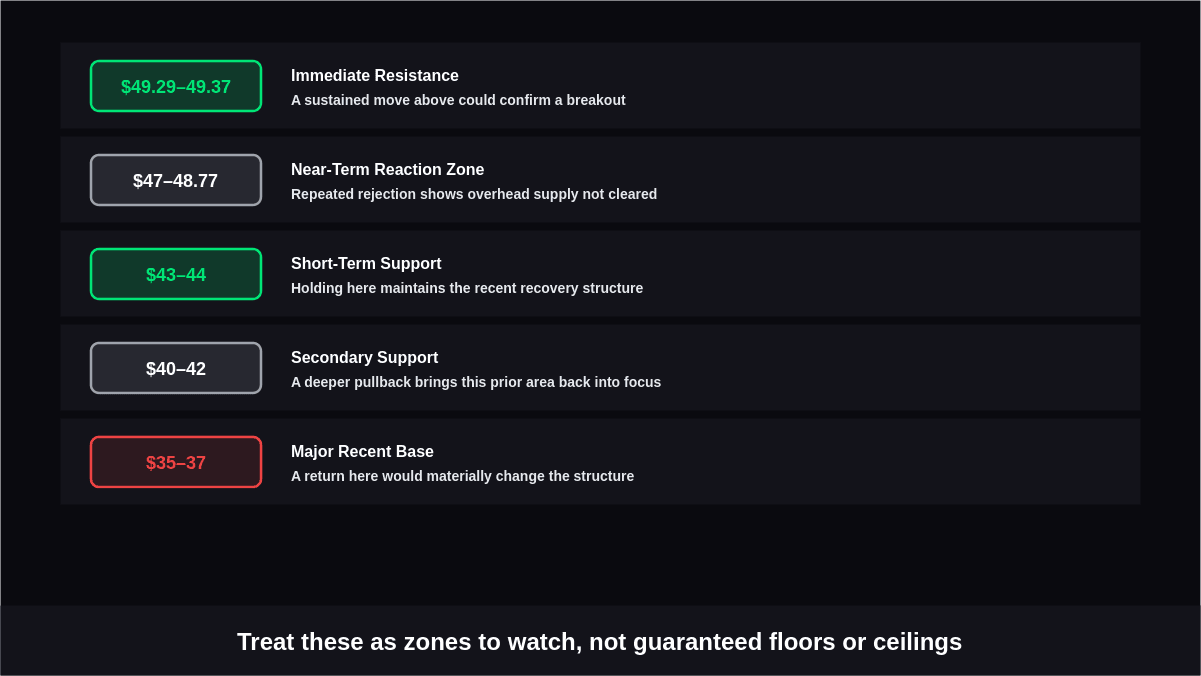
For this IREN stock analysis, the most useful levels come from recent swing highs and lows rather than attempting to predict a single future price.
| Price Area | Role | What Traders Can Monitor |
|---|---|---|
| 49.29 - 49.37 | Immediate resistance | A sustained move above the recent September high could provide breakout confirmation |
| 47 - 48.77 | Near-term reaction zone | Repeated rejection here could show that buyers have not yet cleared overhead supply |
| 43 - 44 | Short-term support | Holding this area could help maintain the recent recovery structure |
| 40 - 42 | Secondary | A deeper pullback could bring this previous September trading area back into focus |
| 35 - 37 | Major recent base | A move back toward this region would materially change the current short-term structure |
The most obvious upside reference is the $49.37 September 23 high, while the recent closing action puts the 44 regions on the other side of the current range. These are chart reference points, not guaranteed floors or ceilings.
A useful chart should show these as zones rather than artificially precise lines, since price can move through a level intraday without establishing a meaningful breakout.
What Would Confirm an IREN Breakout?
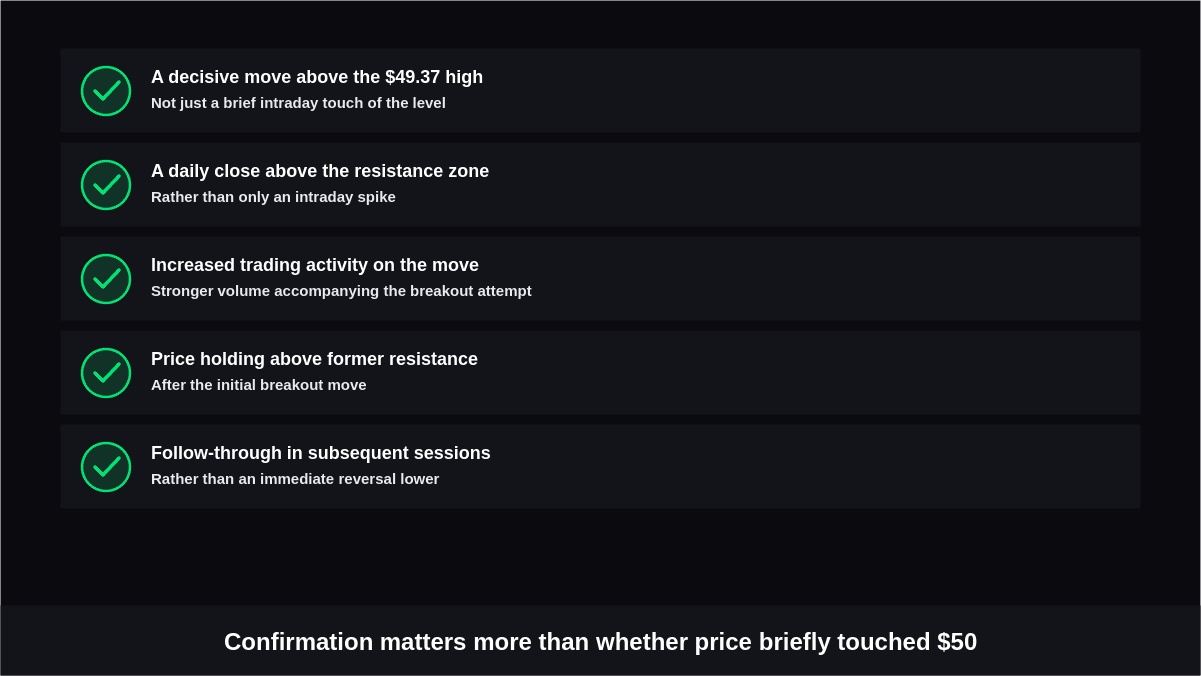
A move above resistance alone does not necessarily establish a confirmed breakout. Traders often look for additional evidence that distinguishes a sustained move from a temporary move above resistance.
For IREN, a stronger breakout setup could involve:
- A decisive move above the recent $49.37 high.
- A daily close above the resistance zone rather than only an intraday spike.
- Increased trading activity accompanying the move.
- Price holding above the former resistance area after the initial breakout.
- Follow-through in subsequent sessions rather than an immediate reversal.
This distinction is important because IREN has already demonstrated that it can move sharply within a single session. For example, September 8 reached an intraday high of $49.29 before the stock subsequently moved lower.
That makes confirmation more informative than simply asking whether the price briefly touched $50.
The Role of Volume in the Breakout
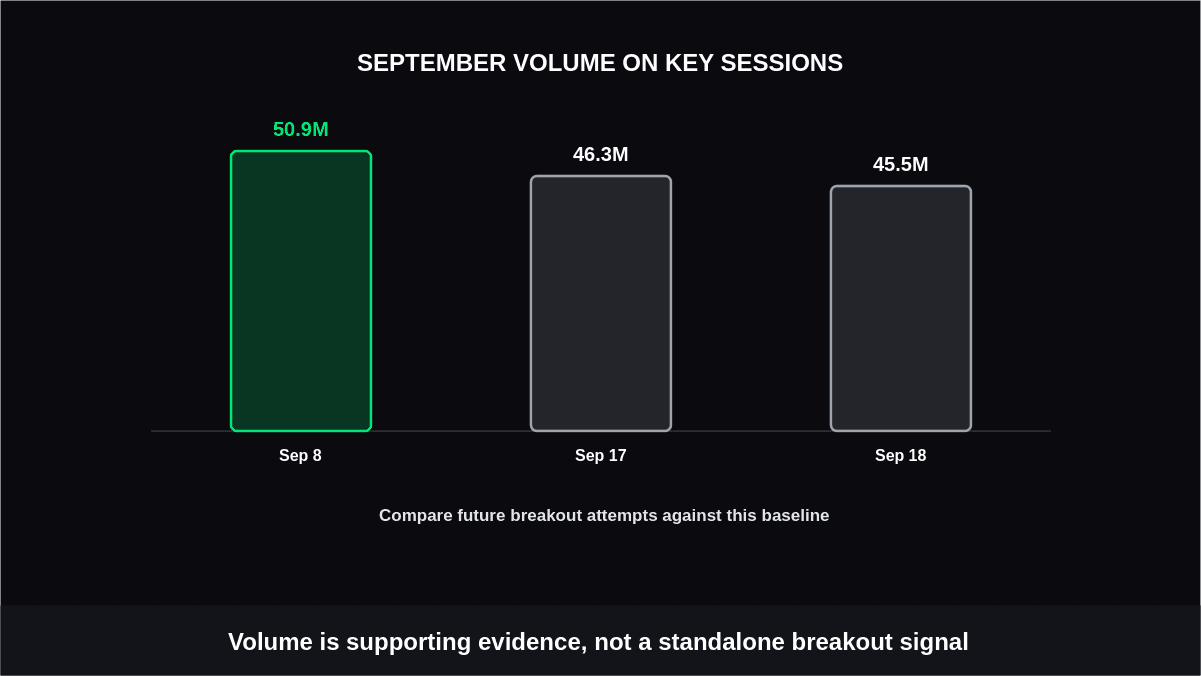
Volume can provide additional context when assessing whether a price move has broad participation behind it.
IREN's September rally was accompanied by several high-volume sessions. September 8 recorded more than 50.9 million shares, while September 17 and September 18 recorded approximately 46.3 million and 45.5 million shares, respectively.
If IREN approaches the recent high again, traders can compare the volume accompanying that move with previous breakout attempts.
Points worth monitoring include:
- Whether volume expands as price approaches resistance.
- Whether a breakout occurs with stronger participation than the preceding consolidation.
- Whether volume remains elevated after the initial move.
- Whether a price breakout occurs on comparatively weak activity.
Volume should be treated as supporting evidence rather than a standalone signal.
What Could Invalidate the Breakout Setup?
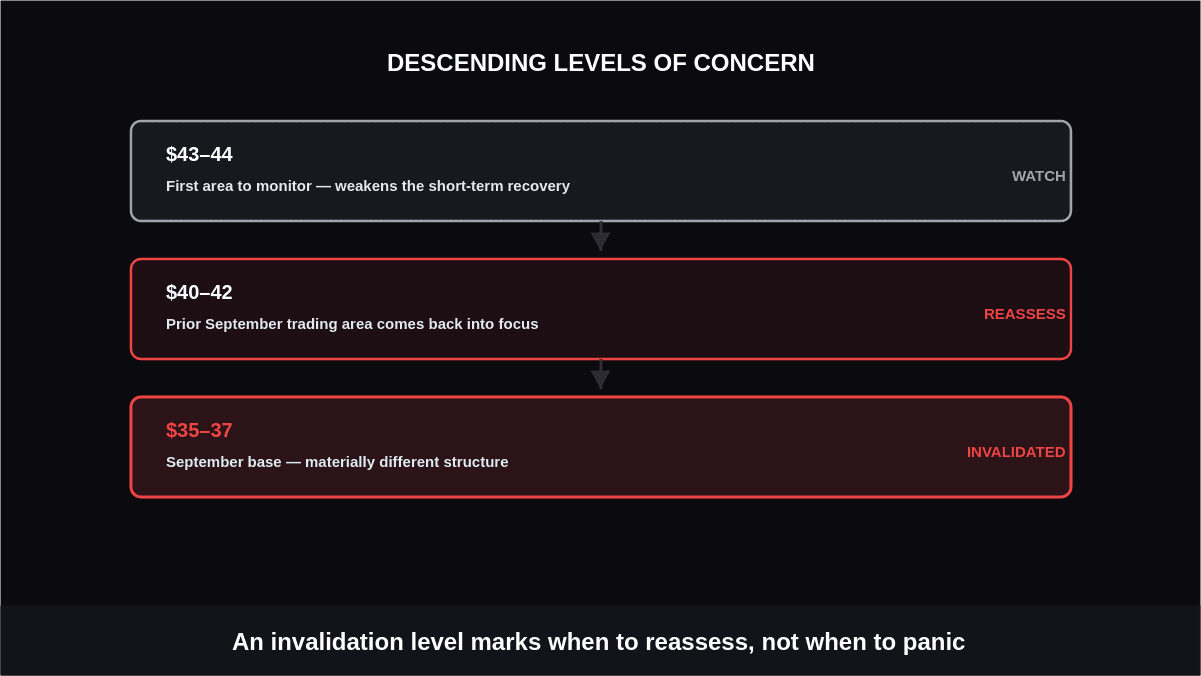
A breakout thesis also needs a clear point at which the underlying setup becomes less convincing.
For the current chart structure, a sustained move back below the recent support areas would weaken the short-term recovery. The first area to monitor is around 44, followed by the 42 region.
A deeper decline toward the September base around 37 would represent a substantially different structure from the one created during the September rally. IREN reached a September low of $35.14 on September 1 before beginning its recovery.
The purpose of an invalidation level is not to predict that a decline will happen. It defines when the original chart scenario should be reassessed instead of being treated as continuously valid.
IREN Stock Price Scenarios to Monitor
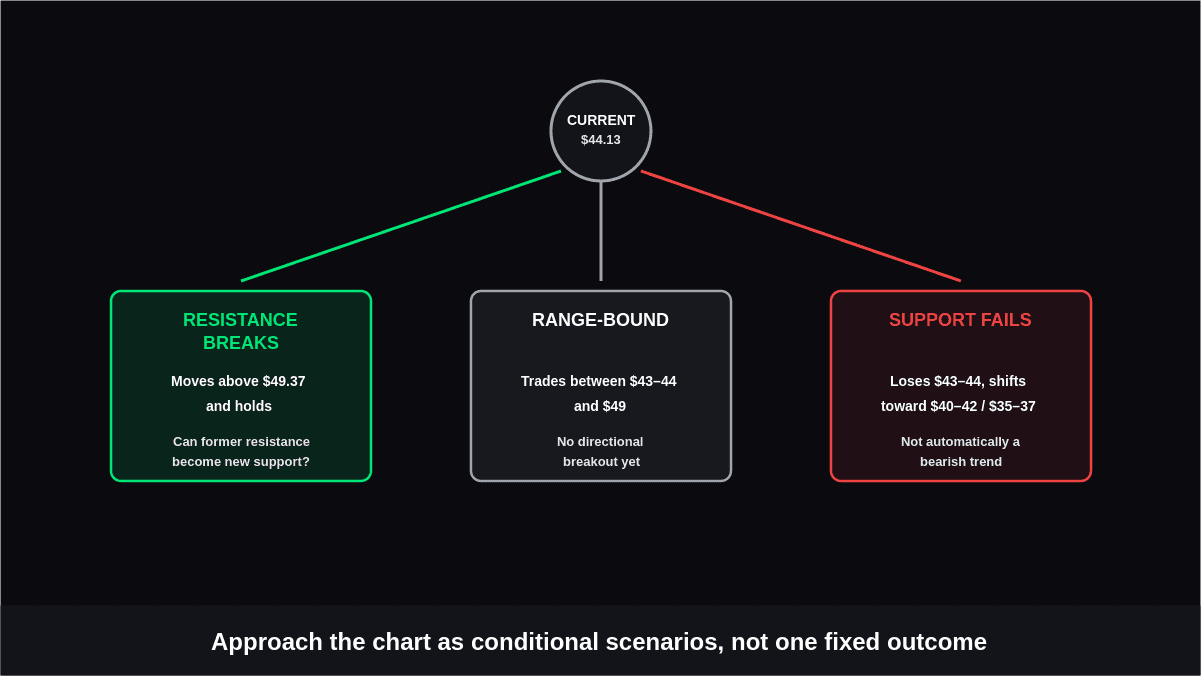
Rather than assigning a single expected outcome, the chart can be approached through several conditional scenarios.
Scenario 1: Resistance Breaks
If IREN moves above the recent $49.37 high and establishes price above that area, traders can then monitor whether the support and resistance level receives follow-through.
The important question becomes whether former resistance can develop into a new support area.
Scenario 2: Price Remains Range-Bound
IREN could continue trading between its recent support and resistance zones without establishing a directional breakout.
In that situation, the $49 area remains the upside reference while the 44 region becomes important for assessing whether buyers continue defending the recent range.
Scenario 3: Support Fails
If IREN loses the nearby support area and continues lower, attention can shift toward the 42 zone and potentially the September base around 37.
This would not automatically establish a bearish trend; it would simply indicate that the recent breakout attempt has lost its immediate structure.
What the IREN Chart Could Signal Next
The chart currently presents a clear decision area rather than a confirmed directional outcome. IREN's September advance brought the stock close to the 50 region, but the September 23–25 pullback shows that resistance has not yet been decisively cleared.
For traders monitoring the setup, the key observations are straightforward:
- Above $49.37: watch for sustained breakout confirmation.
- Around 49: monitor whether resistance continues to reject price.
- Around 44: watch whether recent support holds.
- Around 42: reassess the strength of the September recovery.
- Around 37: a return here would significantly alter the recent structure.
These levels should be treated as reference points for chart analysis rather than predictions of where IREN will trade next.
Conclusion
The current IREN breakout setup is centered on a relatively clear technical range. The recent September high around $49.37 is the key resistance reference, while the 44 area provides an important nearby support zone based on recent price action.
Rather than assuming that a move through resistance automatically confirms a breakout, traders can watch for a daily close, follow-through, volume participation, and the behavior of price after the initial move.
If support fails instead, the 40–42 and 35–37 areas provide additional chart references for reassessing the setup. This approach keeps the analysis focused on observable price behavior and the key levels that can help define the setup.