The KEEL chart is currently showing a clear battle between a recent recovery and renewed selling pressure. Keel Infrastructure Corp. (NASDAQ: KEEL) closed at about $3.60 on September 28, 2026, following several sessions of declines after reaching an intraday high of $4.23 on September 22.
That recent movement gives traders several price areas to monitor rather than requiring an immediate directional conclusion. The $3.60 area has become particularly relevant after the stock moved sharply higher earlier in September, while the 4.23 region now provides a useful reference for assessing whether buyers can regain control of the recent range.
In this article, we will map the current KEEL stock setup, identify important price levels, compare potential bullish and bearish evidence, and explain what traders can watch for before drawing conclusions from the chart.
What Is the Current KEEL Chart Setup?
KEEL has experienced substantial short-term movement throughout September. The stock climbed from a September 1 close near $3.07 to $4.01 on September 18, including an 11.08% gain on September 18 alone. It subsequently reached an intraday high of $4.23 on September 22 before retreating to $3.60 by September 28.
This creates a chart structure with identifiable reaction zones on both sides.
The immediate question is not simply whether KEEL will rise or fall. Instead, traders can monitor whether price holds the lower area, reclaims the middle of the recent range, or breaks beneath established support while evaluating support resistance with confirmation.
Recent Price Structure
Several recent sessions help define the setup:
- September 18 closed at $4.01 after reaching $4.09 intraday.
- September 22 reached an intraday high of $4.23 and closed at $4.15.
- September 23–25 produced consecutive lower closes.
- September 25 traded between $3.73 and $4.00.
- September 28 closed at approximately $3.60, with an intraday range of 3.81.
These levels create a useful framework for separating nearby support from overhead resistance.
Key KEEL Price Levels to Watch
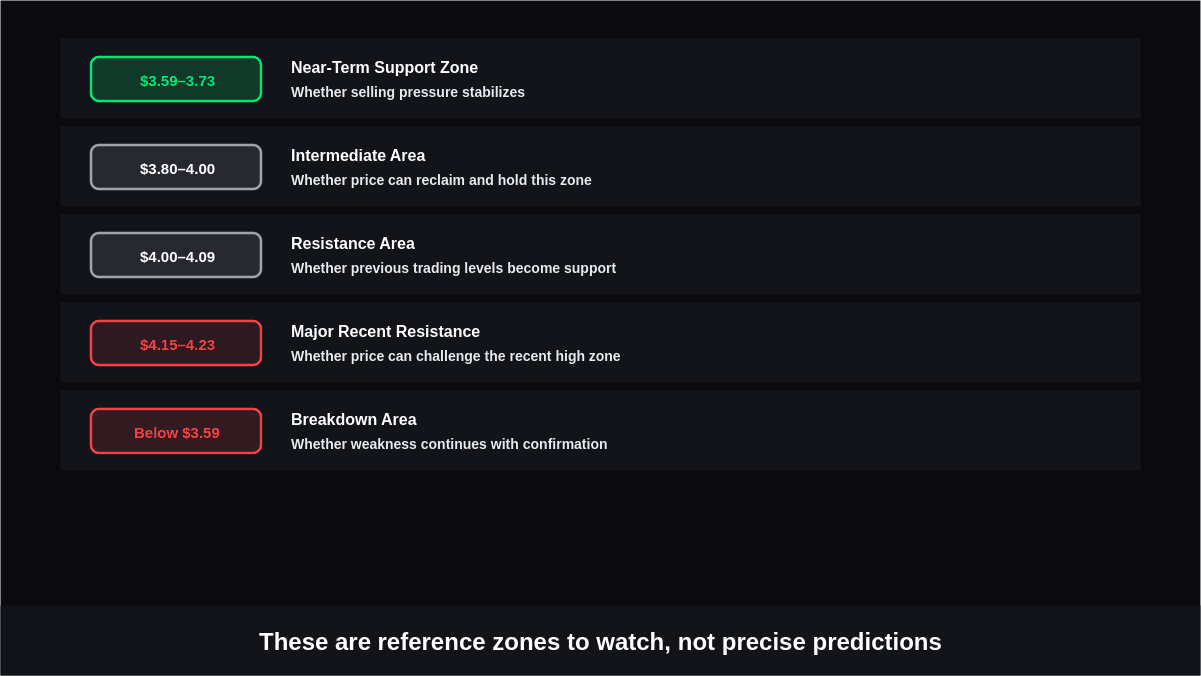
The current KEEL price levels can be organized into three broad areas: immediate support, the middle of the recent range, and overhead resistance.
| Price Area | Chart Role | What to Watch |
|---|---|---|
| 3.59 - 3.73 | Near-term support zone | Whether selling pressure stabilizes |
| 3.80 - 4.00 | Intermediate area | Whether price can reclaim and hold this zone |
| 4.00 - 4.09 | Resistance area | Whether previous trading levels become support |
| 4.15 - 4.23 | Major recent resistance | Whether price can challenge the recent high zone |
| Below $3.59 | Breakdown area | Whether weakness continues with confirmation |
These should be treated as reference zones rather than precise predictions. Price can move through an area temporarily before reversing, so a single intraday move does not necessarily establish a durable breakout or breakdown.
Where Is KEEL Support Forming?
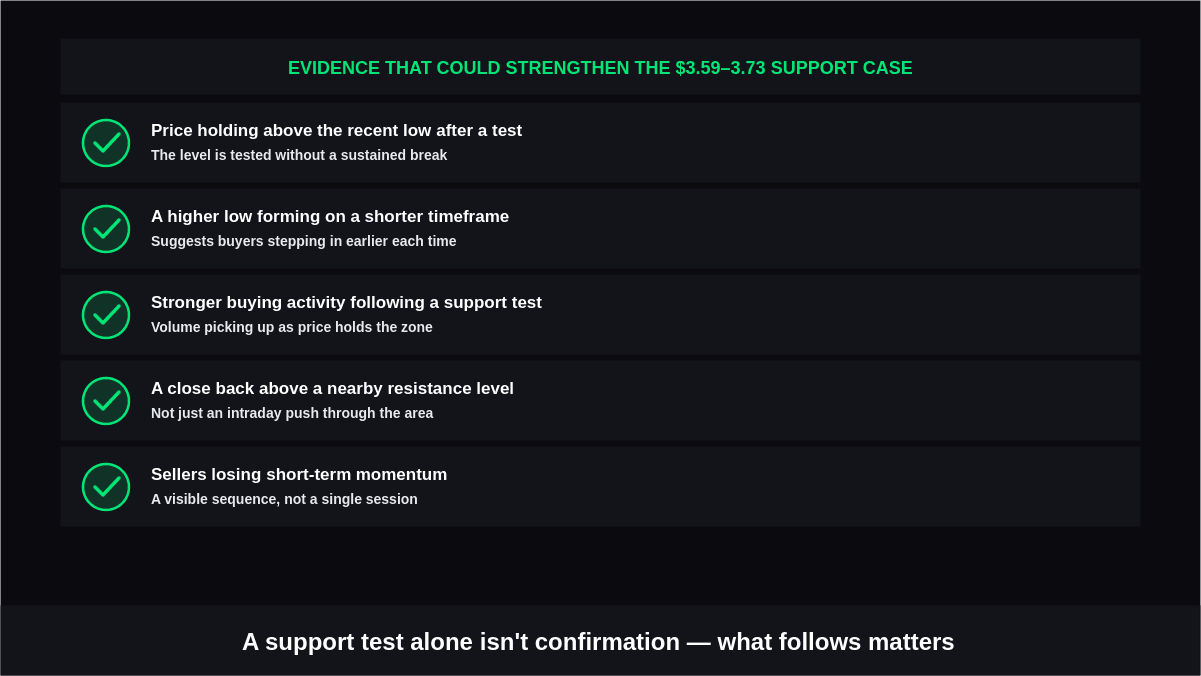
The first area to monitor is around 3.73. This zone incorporates the September 25 low of $3.73 and the September 28 low of approximately $3.59.
The importance of this area comes from recent price behavior rather than an assumption about what must happen next.
Evidence That Could Strengthen the Support Case
Traders examining this zone can look for:
- Price holding above the recent low after testing the area.
- A higher low forming on a shorter timeframe.
- Stronger buying activity following a support test.
- A close back above a nearby resistance level.
- A sequence showing that sellers are losing short-term momentum.
A support test by itself is not confirmation. The subsequent price behavior provides additional information about whether the level is actually attracting demand.
Where Does KEEL Face Resistance?
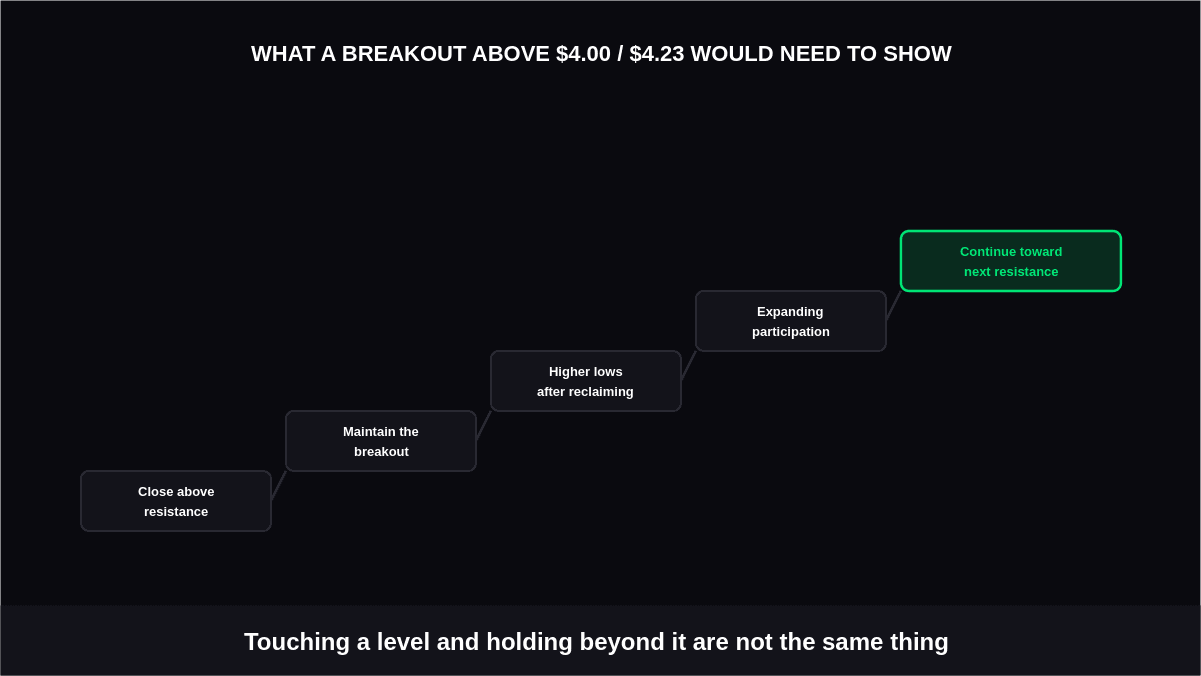
The first major overhead area sits around 4.09, followed by the 4.23 region. KEEL traded around these prices during the strong move on September 18 and the following sessions, with September 22 reaching $4.23 intraday.
These areas can therefore act as checkpoints when evaluating a potential recovery.
Evidence That Could Strengthen a Breakout Case
Instead of treating a move above resistance as automatically bullish, examine whether price can:
- Close above the relevant resistance area.
- Maintain the breakout instead of quickly returning below it.
- Establish higher lows after reclaiming the level.
- Show expanding participation during the move.
- Continue toward the next resistance zone rather than immediately stalling.
A temporary move above $4.00 or $4.23 would need to be evaluated in context. The quality of the move and subsequent price behavior matter more than simply touching a level.
What Would Confirm a Shift in the Setup?
A useful way to read the KEEL support and resistance structure is to define confirmation conditions for both directions before watching the next move.
For a recovery scenario, attention could shift toward whether KEEL reclaims the $4.00 area and subsequently challenges the higher resistance zone near 4.23. A sustained move through those areas would provide stronger evidence than a brief intraday spike.
For a weakening scenario, traders can monitor whether price fails to hold the 3.73 area. A break below support followed by continued weakness would represent a different chart condition from simply testing the zone and recovering.
The important distinction is between price touching a level and price establishing acceptance beyond it.
How Volume Can Add Context to the KEEL Setup
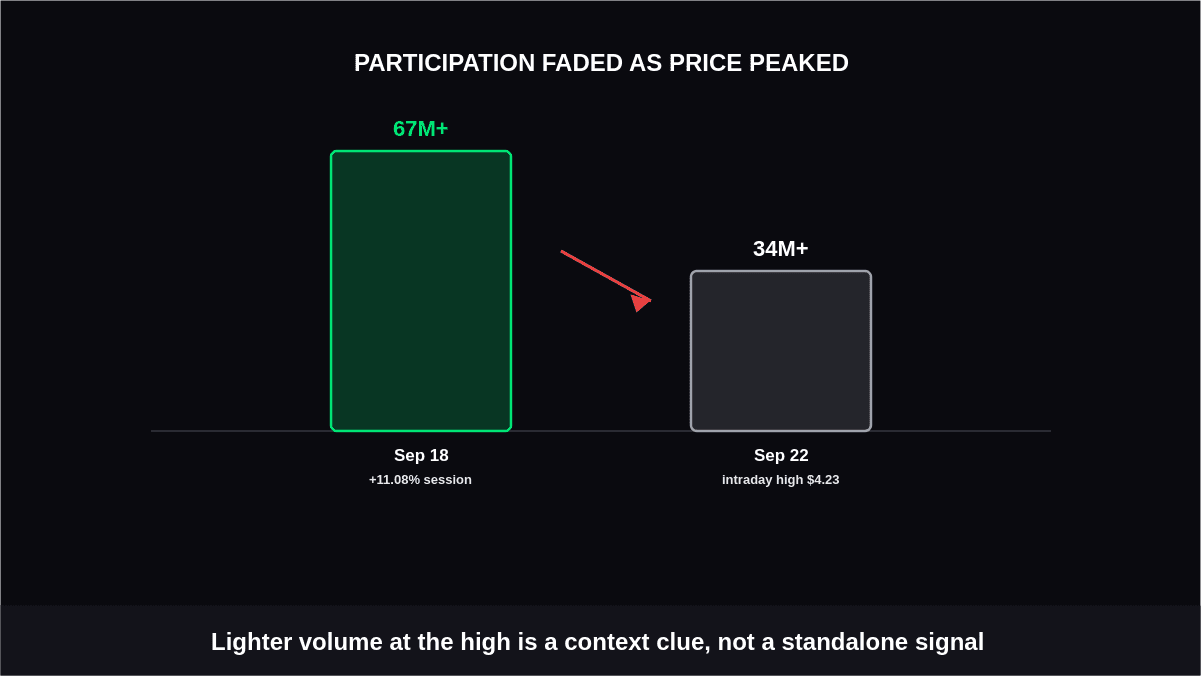
Price levels become more informative when considered alongside trading activity. KEEL has experienced several sessions with elevated volume during its recent price swings. For example, September 18 recorded more than 67 million shares traded, while September 22 recorded more than 34 million.
Volume can help traders assess whether a move has meaningful participation.
When reviewing the chart, consider:
- Whether volume expands during a resistance breakout.
- Whether selling volume increases during a support failure.
- Whether a price move occurs on comparatively light activity.
- Whether volume confirms or conflicts with the direction of price.
- Whether subsequent sessions validate the initial move.
Volume should not be used as a standalone directional signal. Its value comes from adding context to price behavior around important levels.
What the Two Directions Would Need to Show
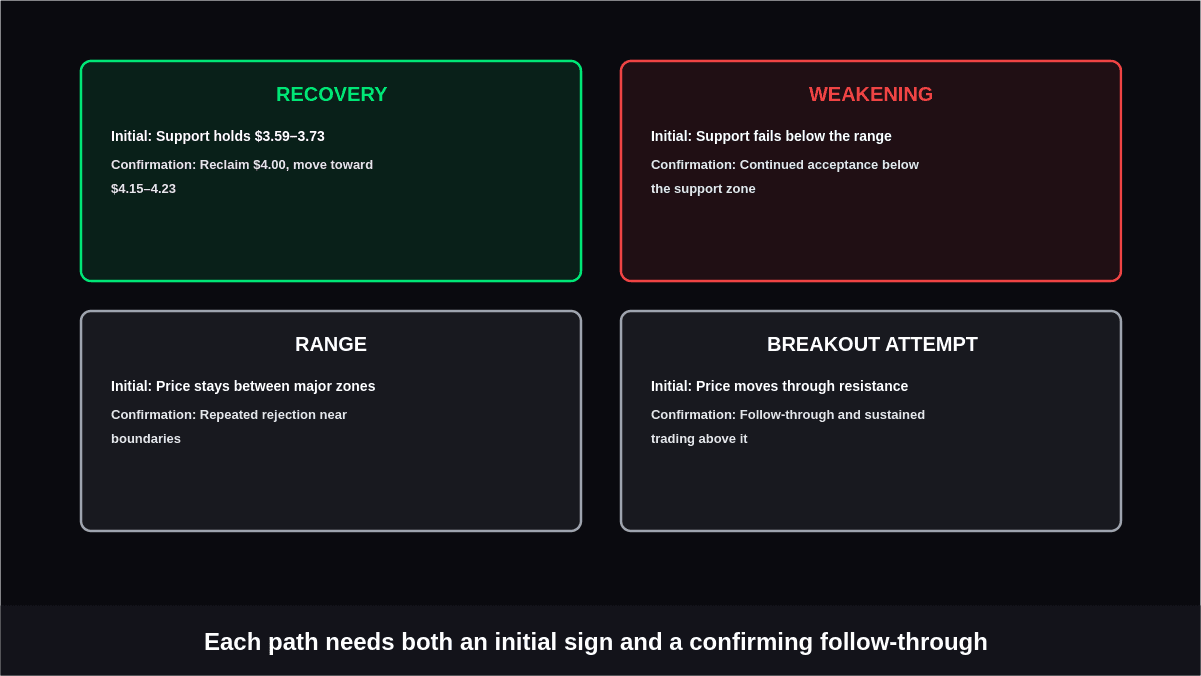
The current setup can be monitored through two conditional paths without assuming which one will occur.
| Scenario | Initial Evidence | Additional Confirmation |
|---|---|---|
| Recovery | Support holds around 3.59 - 3.73 | Reclaim of $4.00 and movement toward 4.15 - 4.23 |
| Weakening | Support fails below the recent range | Continued acceptance below the support zone |
| Range | Price remains between major zones | Repeated rejection near boundaries |
| Breakout attempt | Price moves through resistance | Follow-through and sustained trading above it |
This framework keeps the analysis focused on observable chart evidence rather than trying to predict the next move from one signal.
How to Read the Next KEEL Chart Update
The next useful chart review should begin with the levels already established instead of drawing a completely new interpretation from every candle.
Start by checking where price opens and whether it remains near the recent support zone. Then compare the day's high and low with the $3.73, $4.00, $4.09, and $4.23 reference areas.
After that, examine volume and closing behavior. A move that briefly crosses a level but closes back inside the prior range tells a different story from a move that closes beyond the level and continues holding it.
Finally, compare the new structure with the previous one. Higher highs and higher lows would create a different configuration from lower highs and lower lows, while repeated movement between the same boundaries would suggest that the range remains relevant.
Conclusion
The KEEL chart currently offers several clearly defined areas for observation rather than a single confirmed directional setup. Recent trading places attention around the 3.73 support region and the 4.23 resistance area, with the stock having pulled back after reaching a September 22 intraday high of $4.23.
The next meaningful development depends on how price behaves around those zones. Holding support, reclaiming resistance, breaking below the recent low, or remaining range-bound would each provide different information.
By combining KEEL price levels, volume, closing behavior, and follow-through, traders can evaluate the key levels using observable evidence instead of relying on a predetermined directional call.