Liquidity zones can assist the trader in determining whether an accumulation of orders may have an effect on the market movements. Such price areas tend to form around key highs/lows, recurring price levels, or existing trading zones. Depending on the approach, the price may continue moving faster, break out of the area, reverse from it, or even touch it and move in another direction.
In the following guide, we will explore how to spot such price zones, determine the type of liquidity, verify its behavior, and utilize the information within the context of trading strategy.
What Are Liquidity Zones in Trading
A liquidity zone is simply an area on a price chart where a considerable amount of orders can be clustered together.
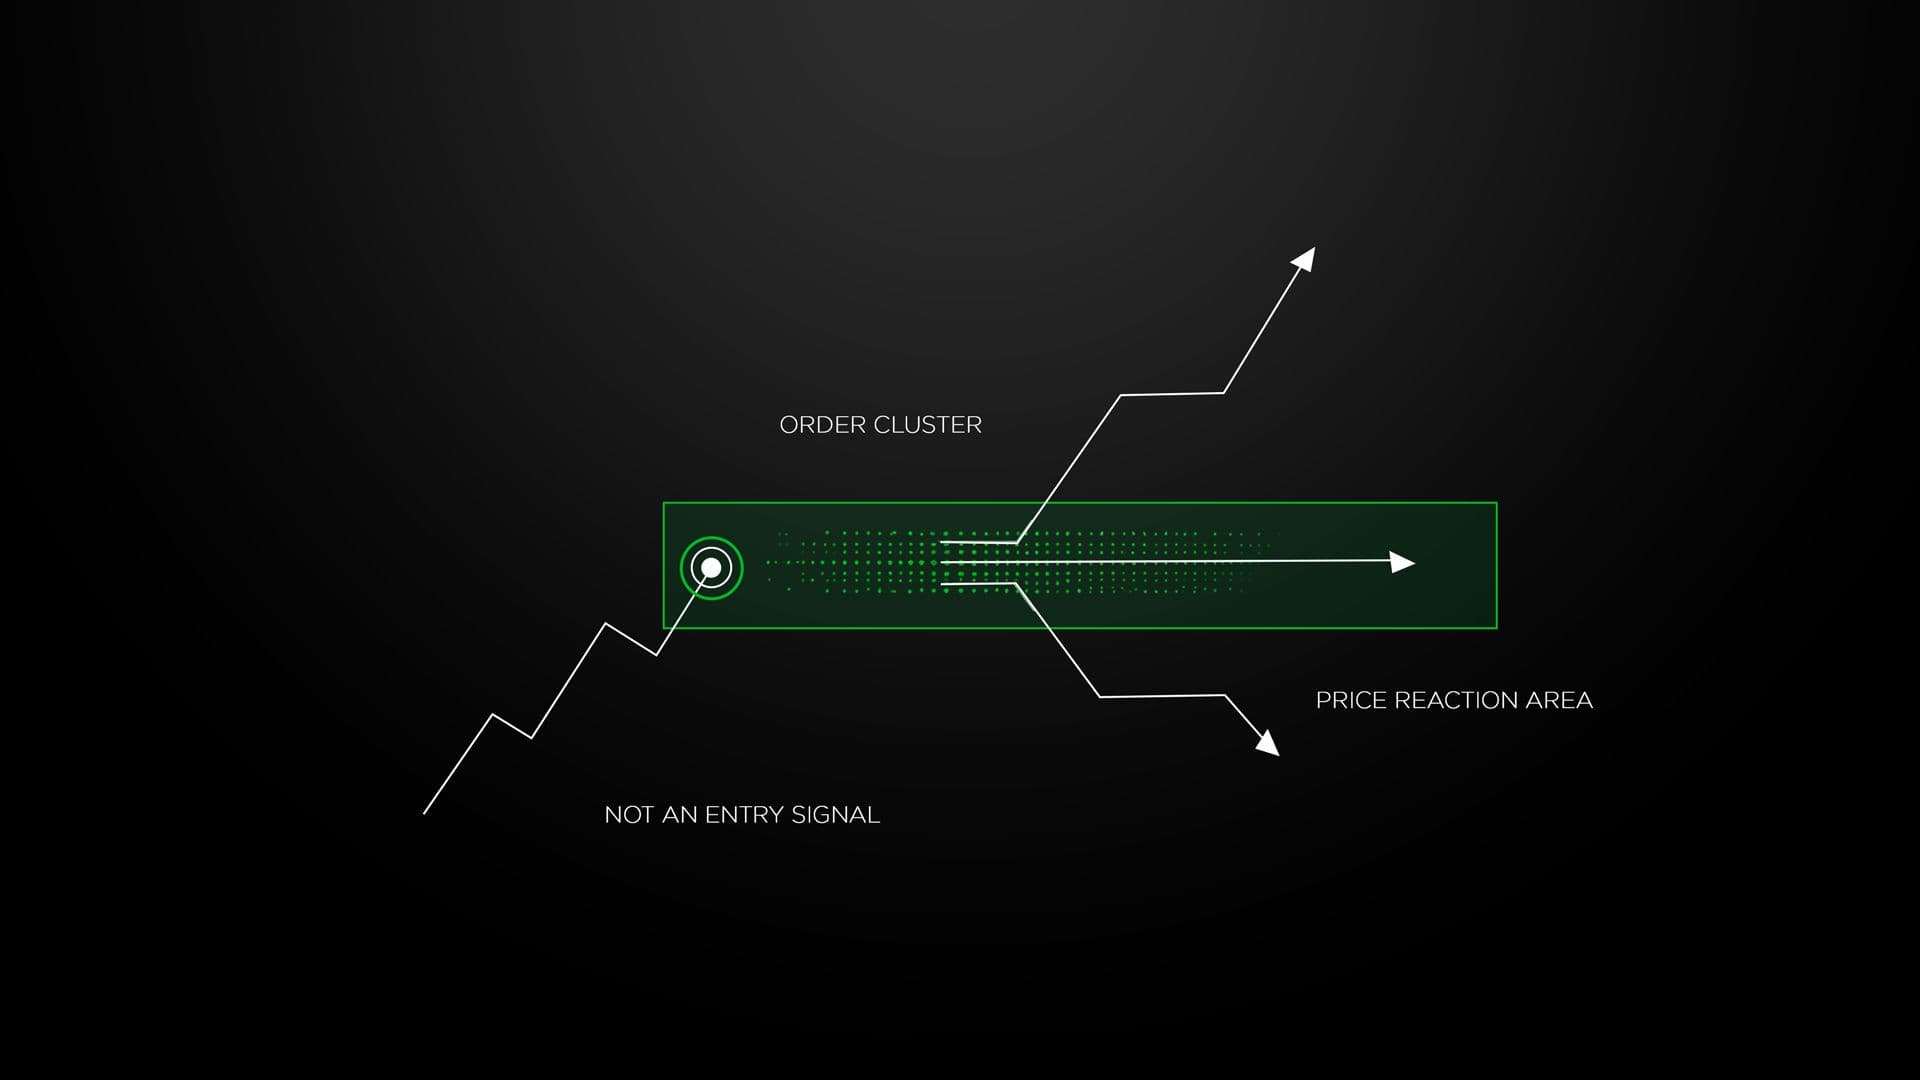
Traders don’t perceive liquidity as a single specific price; instead, they see liquidity as an area where there is a possibility for an increased number of orders to occur. Once price hits that area, it can go through it, stop, reverse, or move beyond it before changing direction.
The discovery of these liquidity zones can help traders identify points on the price chart where considerable order activity is expected to occur. However, the liquidity zone alone does not serve as an entry point.
Why Liquidity Matters in Market Analysis
Since financial markets have various kinds of participants, orders will tend to pile up at specific and easily identifiable price levels. For instance, repeated highs could attract breakout orders and protective stops from short-sellers.
Liquidity analysis allows traders to:
- Locate order accumulation zones
- Predict future sources of volatility
- Know possible reactions of prices
- Merge liquidity with market structure
When price reaches these areas, the resulting orders could lead to a breakout, rejection, or even price sweeping.
Understanding the Different Types of Liquidity
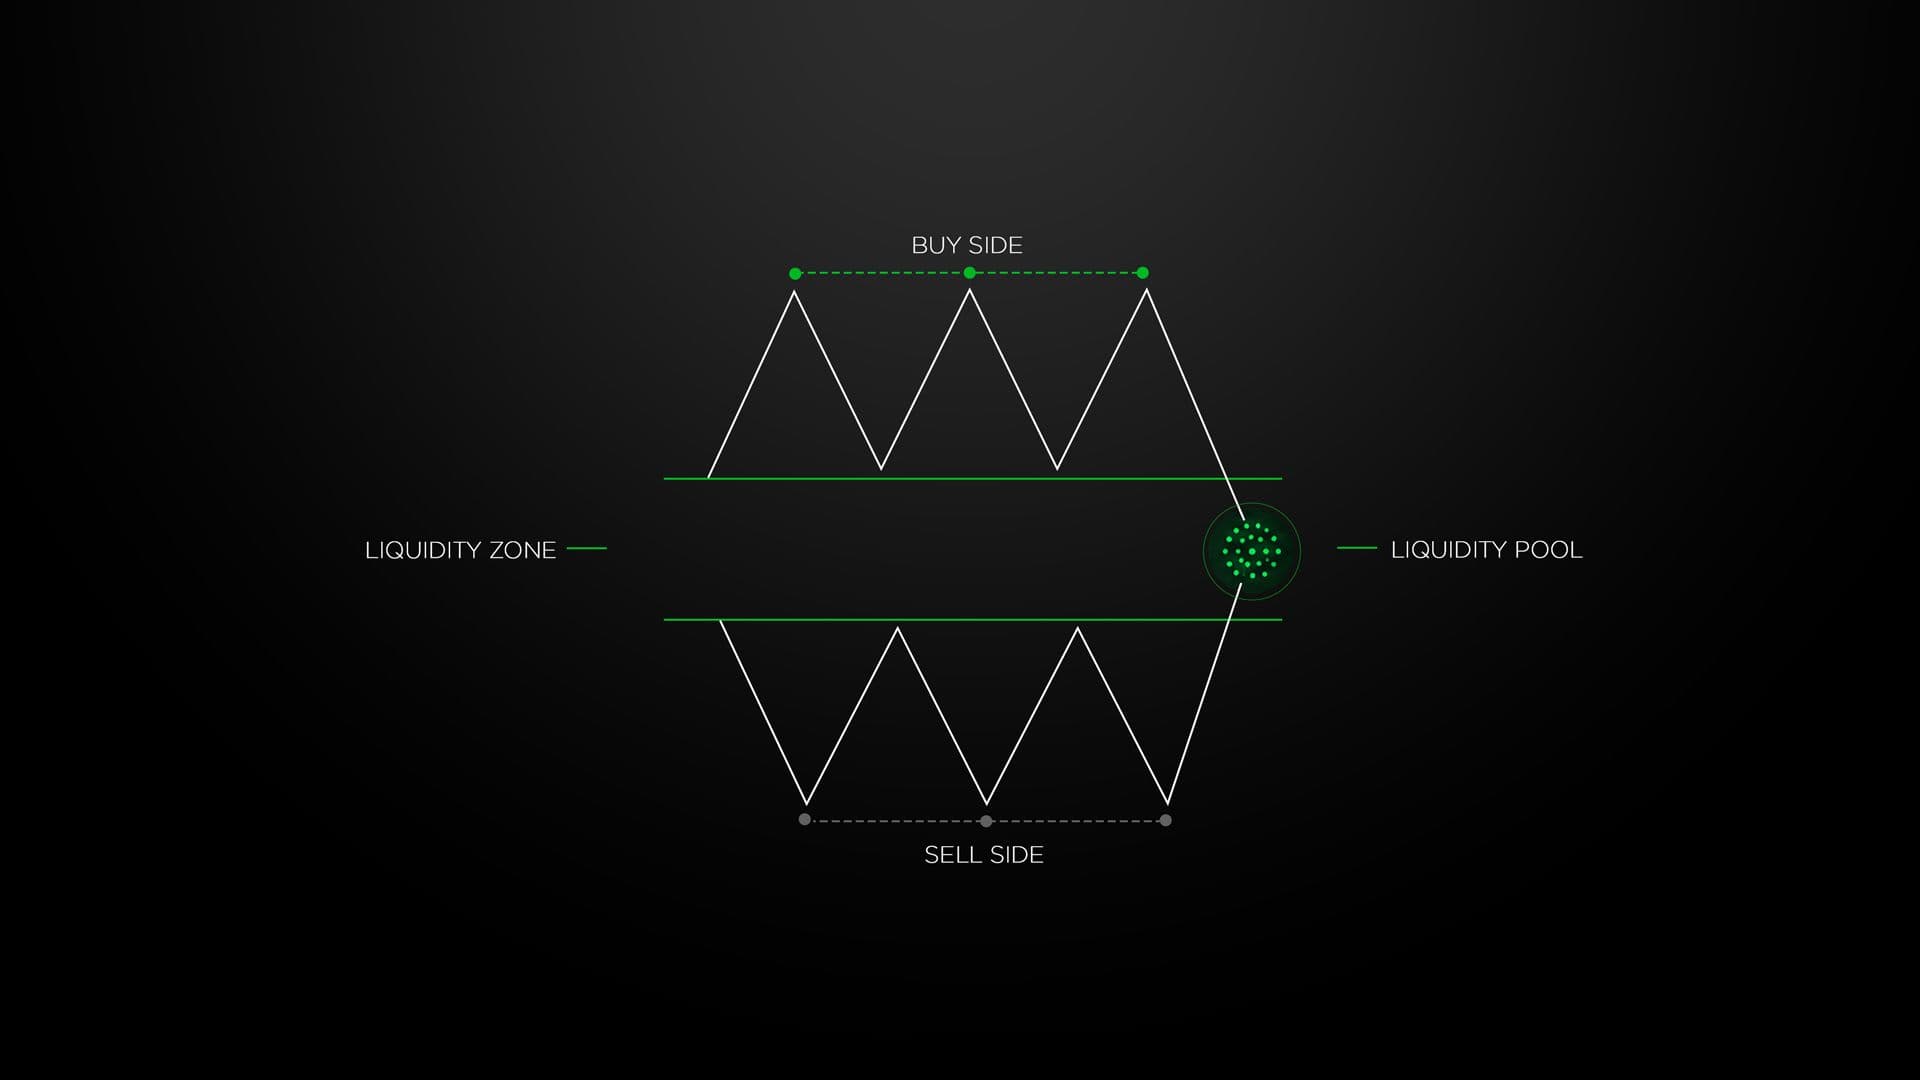
Before undertaking the process, it is crucial that you know the difference between liquidity zones, buy-side liquidity, sell-side liquidity, and liquidity pools. These terms are related, but they refer to different things.
A liquidity zone describes the broader price area being watched, while buy-side and sell-side liquidity describe the potential location of orders within that area. A liquidity pool refers to a concentration of potential orders around a specific level or group of levels.
| Term | Meaning | Common Location |
|---|---|---|
| Liquidity Zone | A broader price area where significant order activity may occur | Around highs, lows, ranges, or other key levels |
| Buy Side Liquidity | Potential orders above important highs | Above swing or equal highs |
| Sell Side Liquidity | Potential orders below important lows | Below swing or equal lows |
| Liquidity Pool | A concentrated collection of potential orders around a visible price level | Around equal highs, equal lows, major highs/lows, or range boundaries |
For example, a previous swing high can form part of a liquidity zone. The potential orders sitting above that high can be described as buy-side liquidity. If several visible highs occur at a similar price, the area above them may represent a more concentrated liquidity pool.
This distinction matters because traders may use the terms interchangeably even though they describe different aspects of the chart. A liquidity zone is the area of interest, buy-side or sell-side liquidity identifies the side where potential orders may sit, and a liquidity pool describes a concentration of those potential orders.
10 Steps to Find the Best Liquidity Zones in Trading
The following steps will help you locate potential liquidity areas, evaluate their significance, and understand how price reacts when those levels are reached.
Step 1: Start With Higher Timeframe Structure
It is important to analyze the entire market structure prior to looking for liquidity zones individually.
Take a higher timeframe to check if the market is trending up, down, or sideways. This will serve as a basis for selecting relevant highs, lows, and ranges.
Concentrate on structural swing points and not on every little price move. One of the major swing highs can be more important than a little five-minute swing low.
Mark:
- Major swing highs
- Major swing lows
- Trading ranges
- Major directional moves
- Rejection areas
This initial analysis helps prevent lower-timeframe noise from dominating your decisions.
Step 2: Mark Significant Swing Highs and Lows
After understanding the overall pattern, one should identify key swing points.
Swing high appears when prices go up, but then fall back. Swing low emerges when prices fall first, and then they go back up. Such points can be easily identified by many traders, thus becoming helpful for liquidity analysis.
Prioritize levels that are:
- Clear on the chart
- Associated with significant price action
- Being tested more than once
- Relevant to the existing market structure
- Still untouched after being formed
Avoid marking every minor high and low. A chart filled with dozens of potential zones makes it harder to distinguish meaningful areas from ordinary market fluctuations.
Step 3: Find Equal Highs and Equal Lows
Equal highs and lows can be a valuable hint when searching for potential liquidity zones. Price levels that recur can be easily spotted by traders and could bring in further orders.
Find:
- Equal highs: Potential orders can accumulate at high price levels.
- Equal lows: Potential orders can accumulate at low price levels.
- Groups: A combination of highs and lows might be more valuable than one swing.
Do not mark all the small swings, focus on the recurring price levels.
Step 4: Identify Buy Side Liquidity
Buy side liquidity is commonly associated with areas above important highs.
Let’s take an example where there is a well-defined swing high. Short-side traders might have stop losses above this point, and breakout traders might have orders to buy above this swing high.
There is a possibility for the concentration of orders in this zone.
If price comes to the area, do not presume that price will reverse instantly. Rather, see what happens:
- Price breaks through the top and continues
- Price goes through the top and then retracts quickly
- Price consolidates at the level
- Price rejects the area before reaching it
The reaction provides additional information about market behavior.
Step 5: Locate Sell Side Liquidity
Sell side liquidityis normally related to low levels that have the ability to attract orders from traders placing sell stops and breakouts.
Look for:
- Major swing lows: Common areas for potential sell-side orders.
- Repeated lows: May indicate a more visible liquidity area.
- Price reaction: Watch whether price breaks through or quickly recovers.
Don't expect that hitting the level will automatically create a reversal pattern.
Step 6: Look for a Potential Liquidity Pool
A liquidity pool is an area where multiple orders may be concentrated.
Potential pools can appear around:
| Market Area | Why It Can Attract Liquidity |
|---|---|
| Previous major high | Stops and breakout orders may sit above it |
| Previous major low | Protective stops may collect below it |
| Equal highs | Repeated levels are highly visible |
| Equal lows | Traders may monitor the same downside level |
| Range boundaries | Orders can build around established extremes |
| Breakout areas | Pending orders may cluster around obvious levels |
These areas should be treated as points of interest rather than guaranteed trade locations.
Step 7: Study the Approach Toward the Zone
The way that the price moves to the liquidity zone can be helpful information.
If it moves slowly to the old high, it can mean different things than when it quickly rallies up to the same point.
Consider:
- Market momentum
- Candle size
- Volatility
- Trading volume when available
- Current trend
- Number of previous tests
This additional context helps determine whether the area deserves close attention.
Step 8: Wait for Confirmation
Reaching a liquidity zone does not automatically mean there is a trade setup. Before entering, traders should define what confirmation they need, such as a rejection, a change in market structure, a strong breakout with follow-through, or a move back into the established range.
The key is to watch the price reaction instead of entering as soon as the liquidity level is reached. Confirmation can help filter out setups where price moves through the zone without showing the expected reaction.
Step 9: Understand Liquidity Sweeps
A liquidity sweep occurs when price briefly moves beyond a level where orders may be concentrated, such as a previous high or low. Price may then return to the prior range or continue in the same direction. What happens after the breach is more important than the breach itself.
A breakout occurs when price moves beyond a significant level and continues in that direction, while a false breakout occurs when price breaks the level but quickly returns below or above it. A liquidity sweep can resemble a false breakout when price briefly moves beyond a visible high or low before returning to the previous range.
Look for:
- ●A brief move beyond a clear high or low
- ●A quick return into the previous range
- ●Strong rejection or a change in price behavior
- ●A shift in market structure
- ●Follow-through confirming continuation or reversal
A sweep does not guarantee a reversal. Traders should watch how price behaves afterward, including whether the breached level becomes support or resistance.
Step 10: Create a Trading Plan
Once you identify a potential liquidity area, define your trade parameters before entering.
| Trading Factor | What to Establish |
|---|---|
| Liquidity area | The price region being monitored |
| Market context | Trend or range |
| Entry condition | Specific confirmation required |
| Invalidation | What proves the setup is wrong |
| Stop-loss | Maximum acceptable trade risk |
| Target | Planned exit area |
| Position size | Capital allocated to the trade |
A predefined plan reduces the temptation to make emotional decisions after price reaches the zone.
Common Mistakes When Finding Liquidity Zones
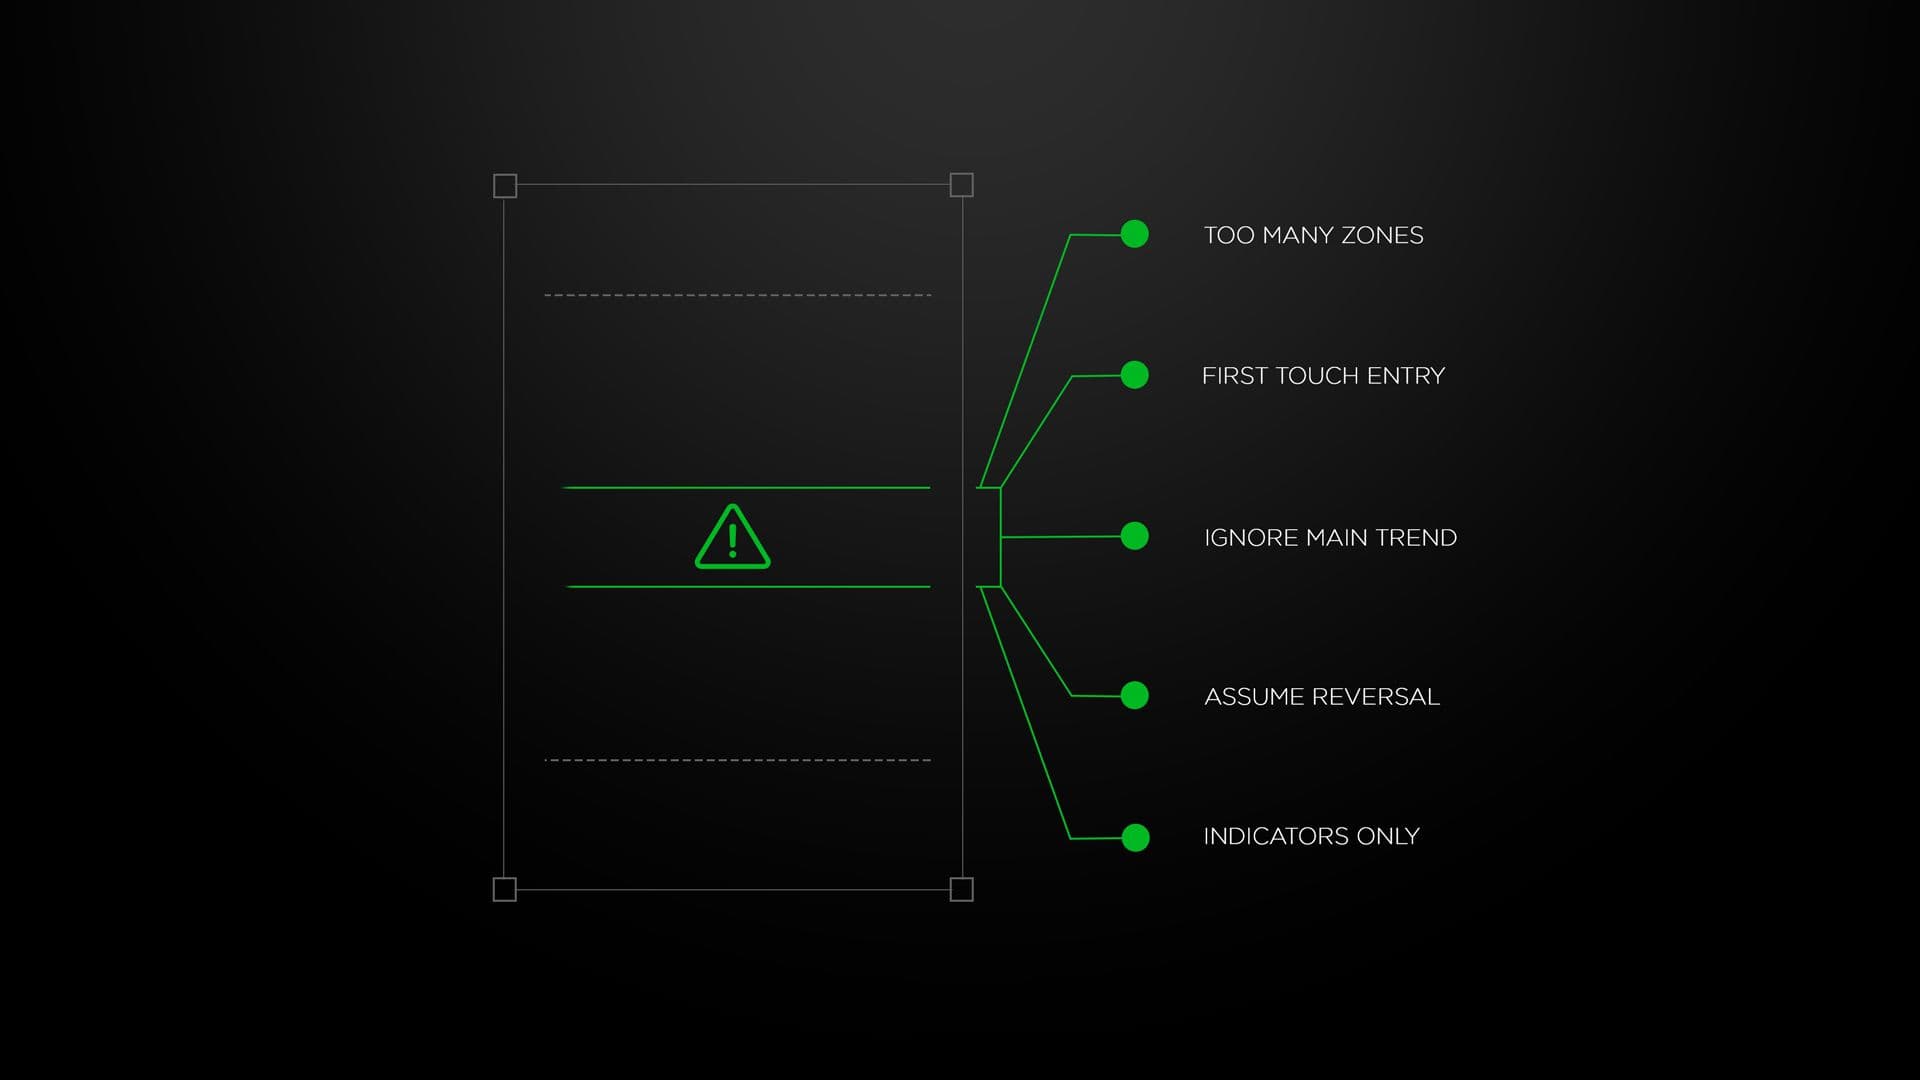
There are several common mistakes that can negatively affect the efficiency of liquidity analysis and result in bad trades. By staying away from them, you will be able to concentrate on important price levels rather than be driven by every market move.
- Putting a mark everywhere: There are too many zones that can create chaos in your chart.
- ●Taking action on the first entry: Price can enter a liquidity zone and continue through it, so wait for the reaction and your predefined entry condition.
- ●Ignoring overall pattern: Signals from smaller time frames may be against the overall trend.
- ●Thinking every sweep will reverse: A sweep can be followed by continuation, so traders should evaluate follow-through instead of assuming a reversal.
- ●Using only indicators: Indicators should assist the trader, not substitute for it.
Conclusion
Liquidity zones provide traders a way of recognizing locations where important order flow events could take place. Starting from a high timeframe structure, finding important highs and lows, finding potential liquidity zones, and watching price action behavior will give the trader a more systematic approach to chart analysis.
The idea here is not to try predicting all possible reactions of the market. Rather, one should look at those zones where something important can happen, wait for some confirmation, and act on that.
FAQs About Liquidity Zones
1. How do you find liquidity zones?
Identify first the swing high and low points, equal highs and lows, and the ranges of price. Next, think about the possibilities that there might be some traders who have put stops or pending orders in those places.
2. Where is liquidity usually found?
Liquidity may be found above major highs and below major lows. Additionally, it may also be found at recurring price levels and established trading ranges.
3. What is the difference between buy side and sell side liquidity?
The term buy side liquidity usually relates to the possibility of orders above key levels, whereas the term sell side liquidity is related to the possibility of orders below key levels.
4. Does price always reverse after reaching liquidity?
Nо. Price may retrace, consolidate, or continue within the area. The reaction once price enters the area is more important than just finding out where it is.
5. Can liquidity analysis be used on every timeframe?
Yes. Liquidity analysis can be used at any timeframe. Yet, larger-timeframe areas usually have more context, whereas smaller-timeframe areas can make individual setups better.
6. What is a liquidity sweep?
A liquidity sweep occurs when price moves beyond a visible high or low where potential orders may be concentrated and then shows a reaction around that level. Traders should watch the follow-through because a move beyond the level can result in either a reversal or continued price movement.