When was the last time you questioned the tools you are trading with? RSI was developed in 1978. MACD came out in the late 1970s, too. Bollinger Bands followed in the 1980s. These tools were built for a different market, one without high-frequency algorithms, without social media driving sentiment swings, and without the sheer volume of participants that exists today.
That does not make them useless. But it does raise a fair question: if the market has changed this much, should the tools you use to read it not have changed too? Algorithms now account for a large share of daily stock volume. Price discovers faster. False signals are more frequent because the market moves in ways these older formulas were never designed to handle. This is exactly why next-gen trading indicators for stocks have become a serious part of how active traders operate. Traders who have brought these newer tools into their setup are working with a genuine information advantage over those still relying entirely on 40-year-old calculations.
What Are Next-Gen Trading Indicators?
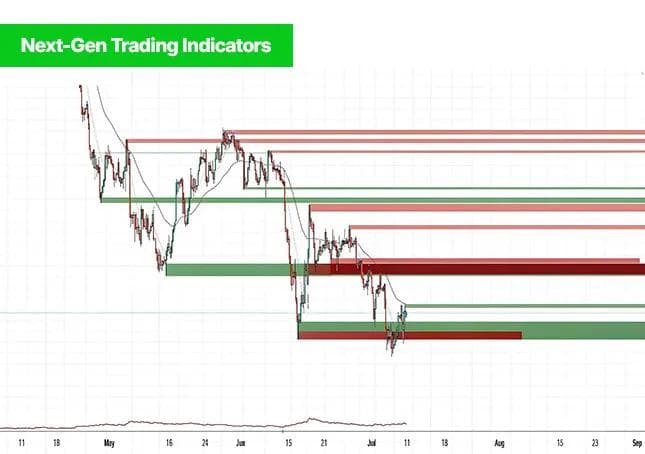
A trading indicator is just a calculation built on price, volume, or time data. It helps you spot trends, momentum shifts, and trade entries or exits. Classic indicators use fixed formulas that do not change regardless of what the market is doing. That is their core problem.
Next-gen indicators address that by using machine learning and real-time data processing. The formula adjusts to current market conditions rather than staying static. They take in more inputs, reduce lag, and produce fewer false signals.
The difference is not complexity for its own sake. It is that these tools were built for markets that move faster and with more participants than the markets those classic tools were designed for.
Classic vs next-gen: the core differences
| Feature | Classic Indicators | Next-gen indicators |
|---|---|---|
| Formula Type | Fixed | Adaptive |
| Signal lag | High | Low |
| False signal rate | Moderate to high | Lower, via ML filtering |
| Data inputs | Price and volume | Price, volume, sentiment, order flow |
| Market adaptability | Low | High |
| Setup Complexity | Simple | Moderate |
The Top 7 Next-Gen Indicators for Stocks
These seven cover different parts of market analysis. They work well together because they are not measuring the same thing.
1. AI-Powered Momentum Oscillators
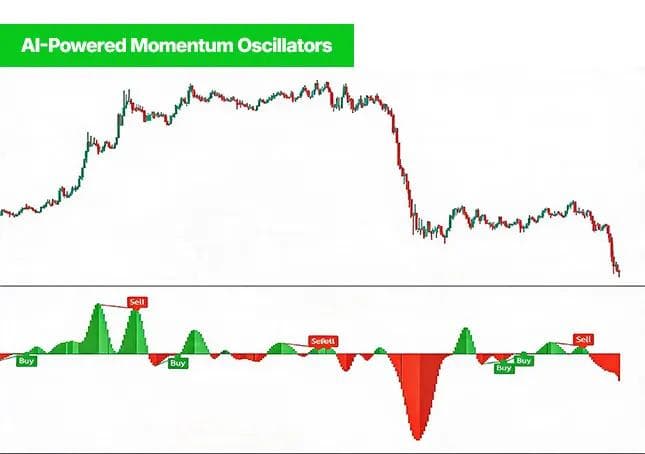
Think of these as an updated RSI. The main difference is that the sensitivity adjusts based on current volatility. In a choppy market the threshold tightens. In a trending market it loosens. You get fewer signals, but the ones you get are more reliable. Tickeron's AI momentum scanner is one of the more widely used examples.
2. Adaptive Moving Averages
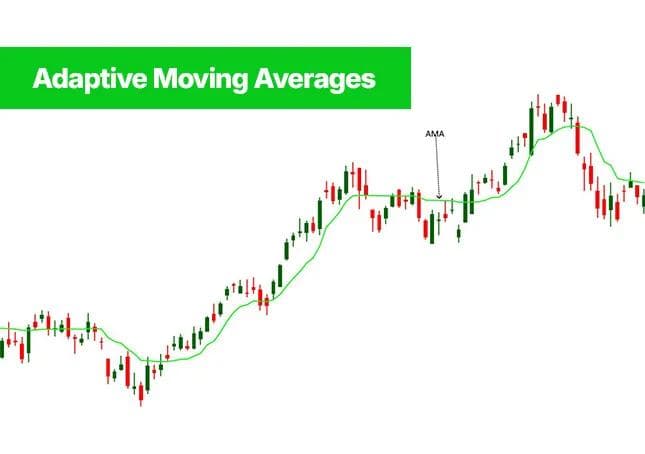
A standard moving average treats all market conditions the same. An adaptive moving average speeds up when price is trending and slows down when it is ranging. This stops you from getting whipsawed when price chops around. The older version is Perry Kaufman's KAMA. Newer builds also factor in volume so the response is more grounded in actual activity rather than just price movement.
3. Volume Profile and Order Flow
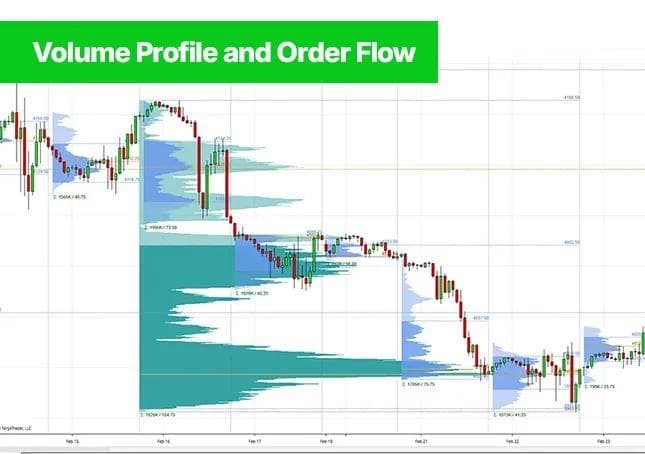
Volume profile maps where the most trading happened at each price level, not just across time. Order flow shows the real-time buy and sell pressure at those same levels. Together they show you where institutions were active, which often turns into areas that hold as support or resistance. NinjaTrader and Sierra Chart both have solid tools for this.
4. Sentiment-Based Indicators
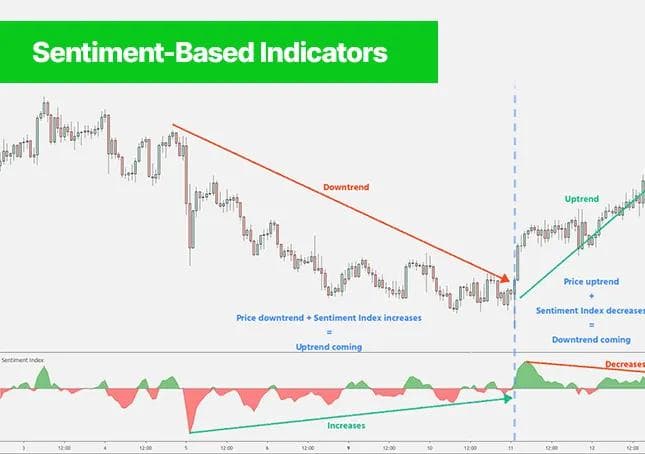
These pull data from news feeds, social platforms, and options markets to measure how positioned the crowd is on a particular stock. Extreme one-sided sentiment tends to show up before reversals. Trade Ideas uses natural language processing to score news sentiment in real time and converts it into a signal you can act on.
5. Multi-Timeframe Confluence Tools
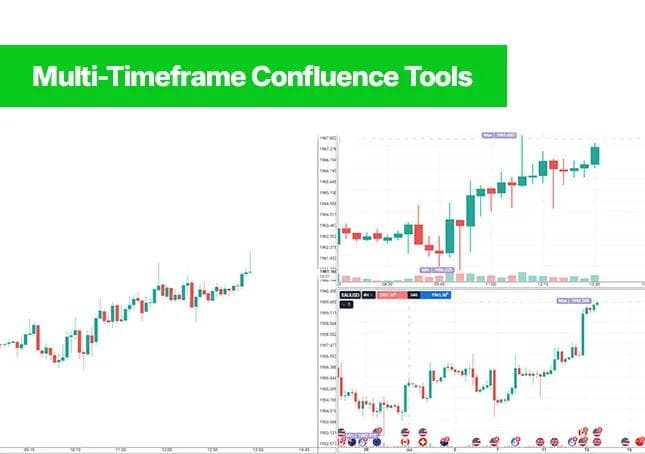
A signal on a 5-minute chart is more meaningful when the hourly and daily chart say the same thing. Multi-timeframe confluence tools do that check automatically. You only get an alert when multiple timeframes line up. It is a simple concept but it filters out a lot of trades that would have gone against the bigger trend.
6. Predictive Pattern Recognition
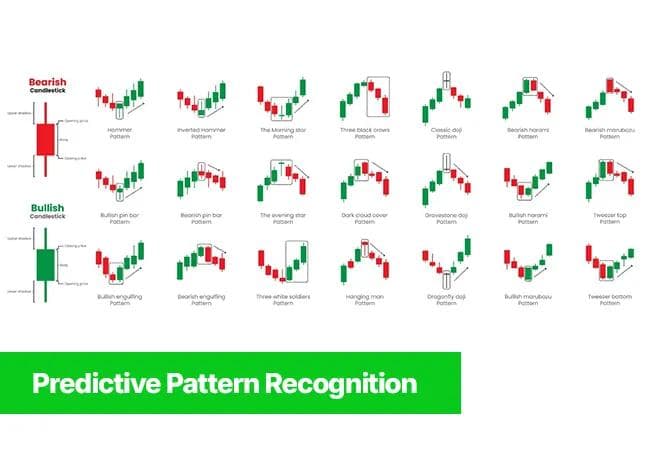
These scanners identify chart patterns as they form, not after the move has already happened. Head and shoulders, bull flags, wedges, they all get scored against historical data from similar market conditions on similar stocks. It takes the guesswork out of manually deciding whether a pattern qualifies.
7. Risk-Adjusted Signal Indicators
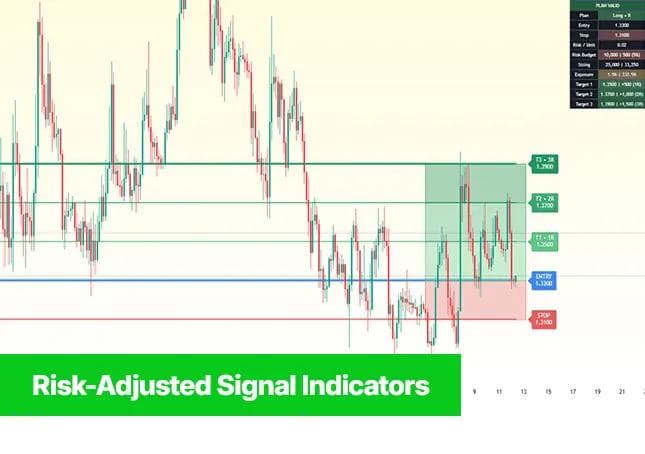
These go beyond the entry. They calculate the stop placement, the target, and the risk-to-reward ratio before you enter. Some more advanced versions also factor in position size relative to your account so you are not risking too much on any single trade without realising it.
How to Use Next-Gen Indicators in Your Strategy
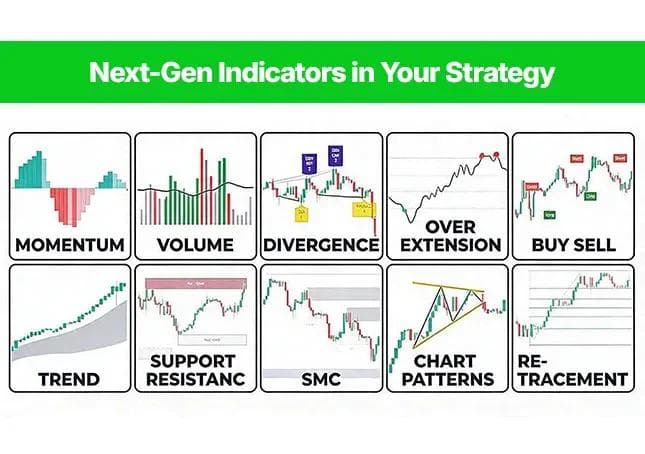
Throwing new indicators onto a chart without a process behind them usually makes things worse, not better. Work through these steps first.
Step 1: Pick tools that match how you trade
Day traders need low-lag signals and volume tools. Swing traders do better with adaptive moving averages and multi-timeframe confluence. Position traders can lean on sentiment and pattern recognition. The timeframe you trade on should drive which tools you pick.
Step 2: Keep it to three indicators at most
More indicators create more conflicting signals. Two or three that cover different things, momentum, volume, entry timing, is enough. Adding more rarely improves accuracy and usually just slows down your decision-making.
Step 3: Test it before trading real money
Run the indicator across at least 100 historical setups in your target market. Track your win rate, average risk-to-reward, and how bad the drawdown gets. If the numbers do not meet your minimum standard, adjust the settings or drop them. Then paper trade for at least two weeks. Backtests can look clean while live conditions behave differently.
Step 4: Set alerts and step away from the screen
Most platforms, including TradingView, let you set custom alerts for when conditions are met. Use them. Watching a chart for hours makes your decision-making worse, not better. You start seeing setups that are not there.
Next-Gen vs Classic Indicators: Which Performs Better?
Depends what you are comparing. Classic indicators are simpler to set up and understand. Next-gen indicators tend to hold up better in fast markets and produce fewer false signals.
Backtests on large-cap US stocks over a 3-year window showed AI-powered momentum oscillators generating around 18% fewer false signals than standard RSI on 15-minute charts. Volume profile consistently outperformed on-balance volume when it came to identifying levels that price actually respected.
Classic indicators are still worth keeping around though. MACD on a weekly chart gives useful trend context. Bollinger Bands help you spot volatility compression before a breakout. The setup that tends to work best is using classics for context and next-gen tools for entries and exits.
| Indicator | Type | False Signal Rate | Best Use Case | Lag |
|---|---|---|---|---|
| RSI (14) | Classic | High in chop | Oversold / overbought on daily | Moderate |
| MACD | Classic | Moderate | Trend confirmation | High |
| AI Momentum Oscillator | Next-gen | Low | Intraday momentum | Very low |
| Adaptive MA | Next-gen | Low | Trend following | Low |
| Volume Profile | Next-gen | Very Low | Support / resistance zones | None |
| Bollinger Bands | Classic | Moderate | Volatility and squeez plays | Low |
| Sentiment Indicator | Next-gen | Varies | Reversal spotting | Real-time |
Best Platforms for Next-Gen Stock Indicators
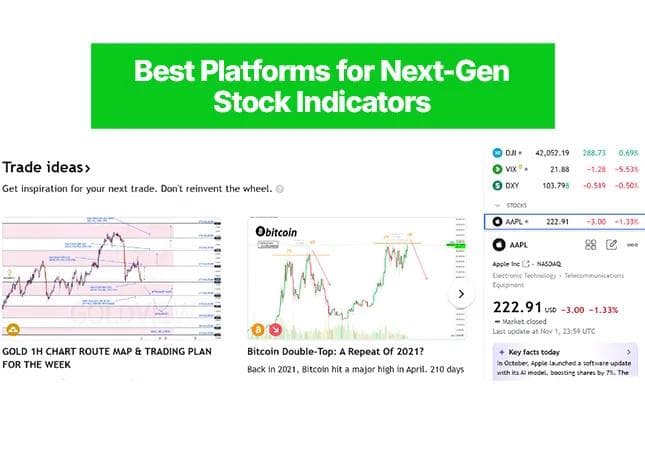
TradingView: The most accessible option for most retail traders. The community library has hundreds of custom indicators including AI-based ones. Pine Script lets you build your own or import others. Start here if you are not sure where to begin.
Trade Ideas: Built around AI scanning. The Holly AI system runs through thousands of stocks in real time looking for momentum and pattern setups. Good for traders who want pre-filtered ideas rather than building their own scans.
NinjaTrader: The go-to for order flow and volume profile work. More complex to get set up than TradingView but the depth of volume data is significantly better. Used mainly by active equity and futures traders.
Thinkorswim: Solid AI scan functionality and a built-in options flow tool. Free with a TD Ameritrade account. Worth exploring if you are already trading through them.
Tickeron: AI pattern recognition is the core product here, not an add-on. Each pattern it detects gets a confidence score based on historical data. Good if pattern trading is your focus.
Sierra Chart: Best raw order flow data available to retail. The learning curve is steep but for serious volume analysis there is nothing better at this price point.
Start with TradingView. If you get serious about order flow and volume profile work, then look at NinjaTrader or Sierra Chart.
Common Mistakes Traders Make With Indicators