An order block indicator may assist in determining price regions where significant buying or selling activity could affect the future course of action in the market. Rather than viewing every candle equally, the trader can use order blocks to study regions where price experienced displacement and similar reactions may occur again.
Order blocks are commonly used in price action and smart money trading approaches. However, proper identification of order blocks requires more than just marking the last candle prior to a major price movement. It also involves considering the market structure, liquidity, momentum, and the reaction to the prospective zone.
This article explains the working of order block indicators, characteristics of a proper order block, and how to use such zones in a trading procedure without relying on an indicator alone.
What Is an Order Block?
An order block is always considered a zone with respect to price action, which is linked to a significant directional movement. In most cases, the zone is usually determined as the candle or candles that are present right before an aggressive move in price action.
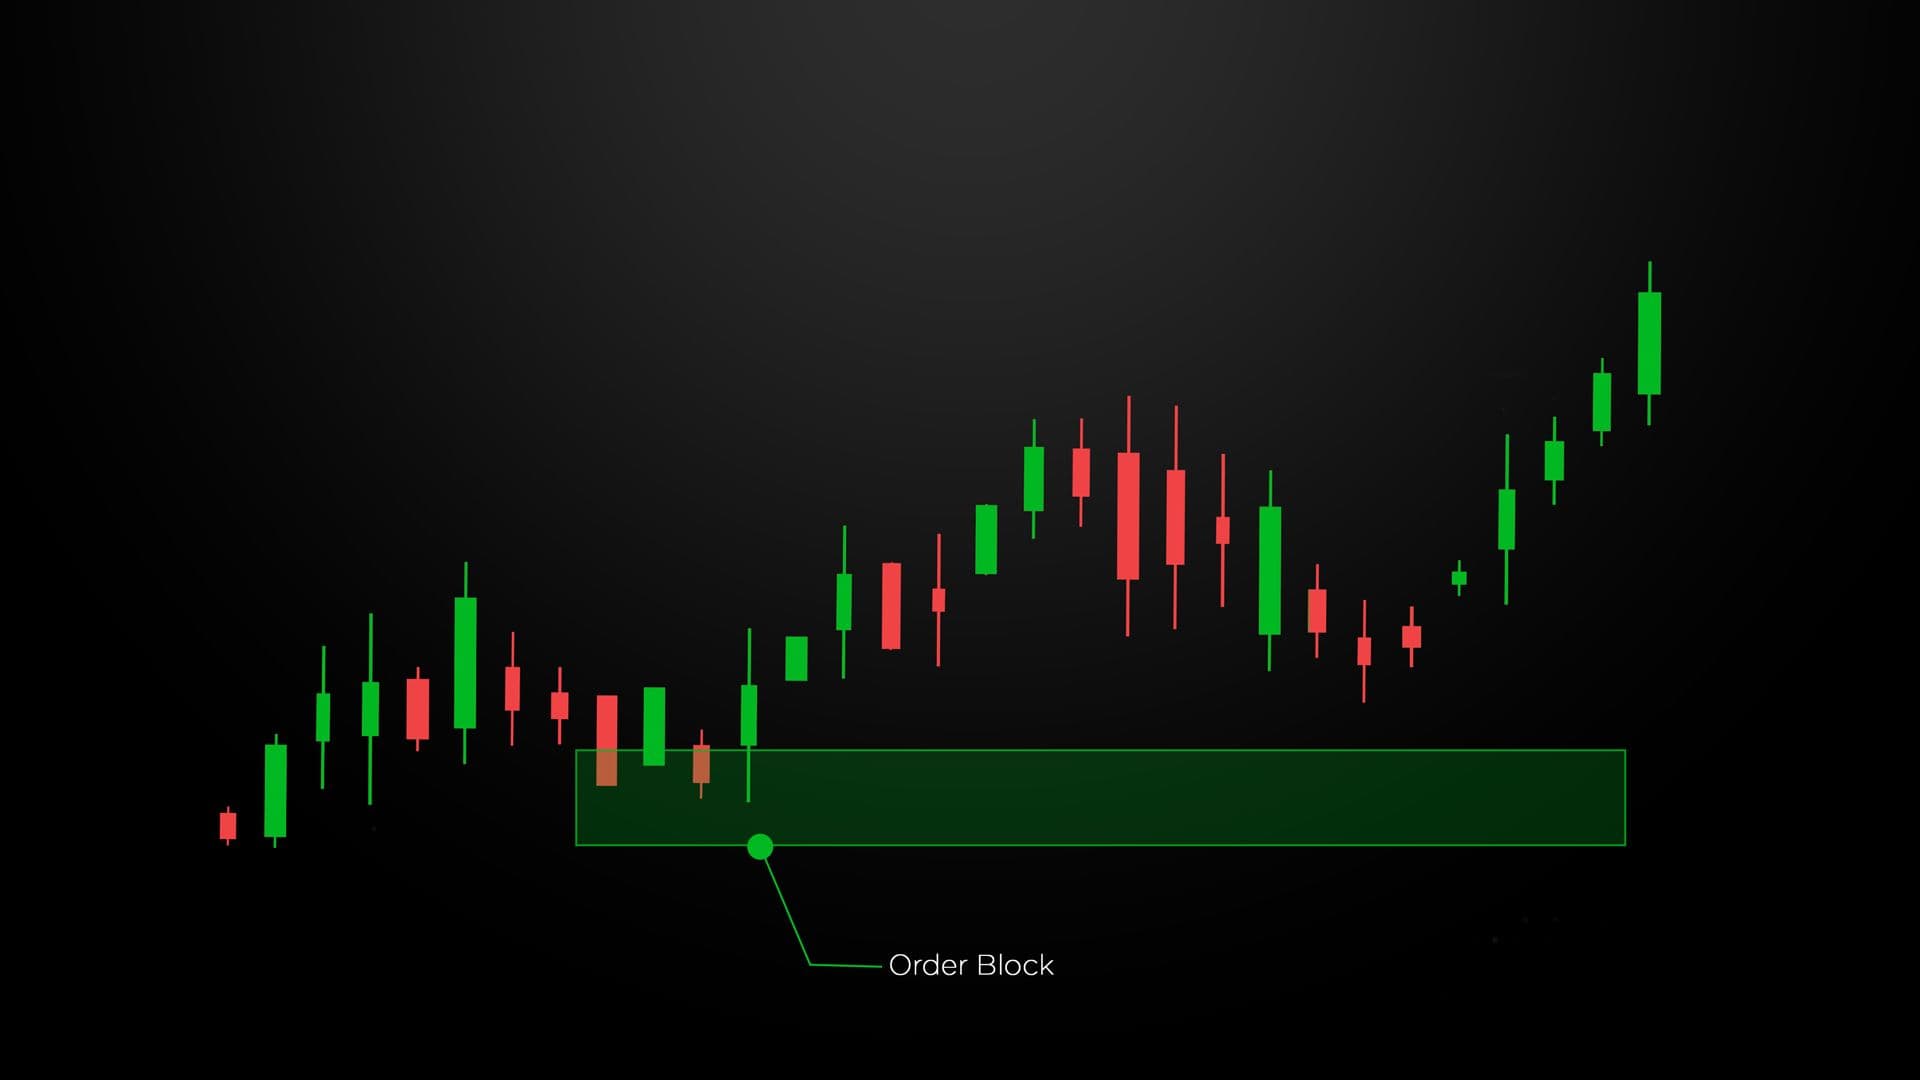
For instance, in a case where the price action suddenly shoots upwards after a consolidation phase, the last bearish candle prior to the sharp rise in prices will be considered a bullish order block.
The main thing to note here is that an order block is not necessarily a trade signal in itself.
How Order Block Indicators Locate Price Zones?
An order block indicator is an automatic component of the chart marking process that looks for price patterns matching certain criteria. It can detect certain areas depending on its configuration, based on one or several of the following criteria:
- Strongly bullish or bearish displacement
- Market structure breaks
- Prior highs or lows
- Prior candle direction before an impulse
- Volatility or volume
- Zones that were already detected earlier
The indicator will normally show a rectangular zone once it spots a trade opportunity. While some will stretch the zone ahead until the price invalidates it, others will cancel or change the zone when certain criteria are met.
Due to the various methods used by different indicators, the same tool can detect different zones even on one chart. This is the reason why traders need to know the method used by any given indicator.
Bullish vs. Bearish Order Blocks: What’s the Difference?
Order blocks can broadly be divided into two categories based on the direction of the anticipated reaction.
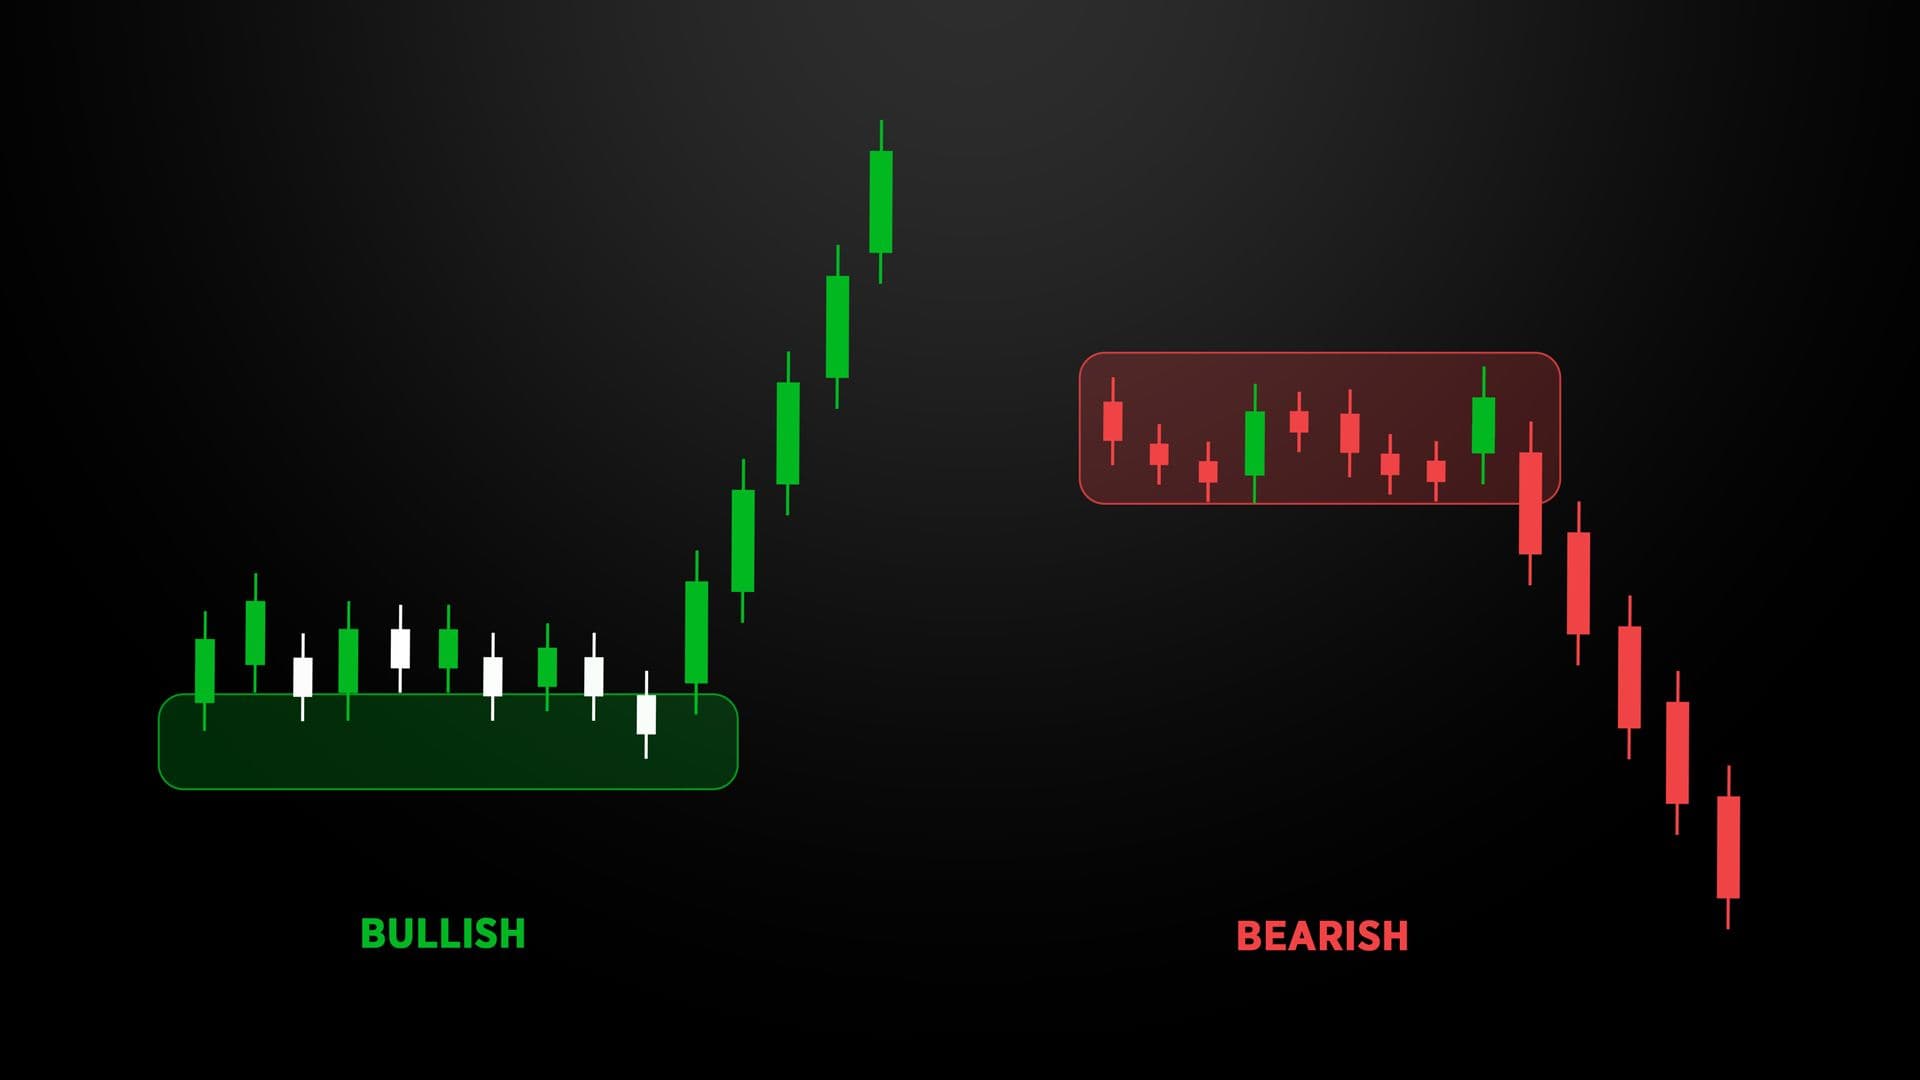
Below you will find a comparison table to understand it better:
| Feature | Bullish Order Block | Bearish Order Block |
|---|---|---|
| Market Direction | Associated with upward price movement | Associated with downward price movement |
| Typical Formation | Often identified around the final bearish candle before a strong bullish move | Often identified around the final bullish candle before a strong bearish move |
| Price Reaction | Traders watch for potential buying interest | Traders watch for potential selling pressure |
| Structure Context | Often supports a bullish market structure or upward break | Often supports a bearish market structure or downward break |
| Invalidation | Price decisively breaks below the zone | Price decisively breaks above the zone |
| Trading Focus | Potential long setups after confirmation | Potential short setups after confirmation |
5 Steps to Identify High Price Zones With an Order Block Indicator
An order block indicator can help traders locate areas where strong buying or selling activity may have occurred. However, each zone should be evaluated using market context rather than treated as an automatic trade signal.
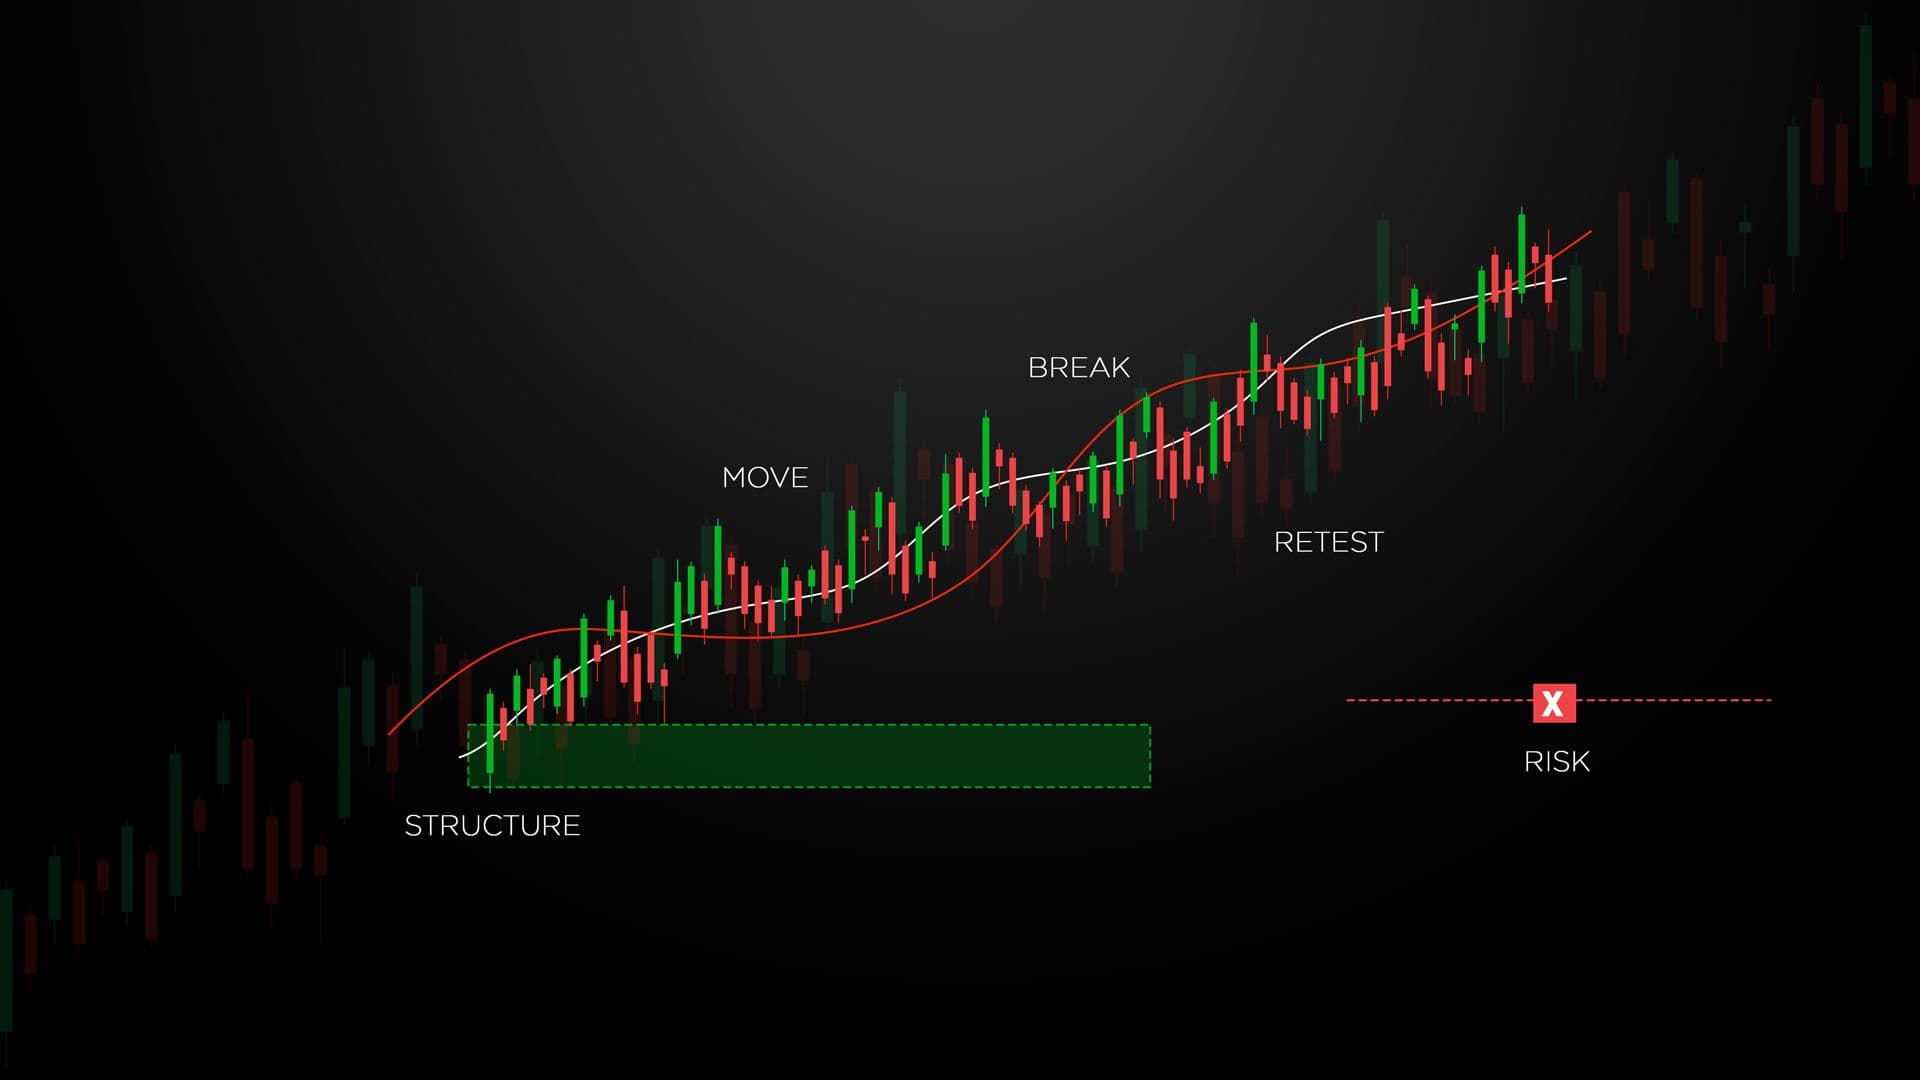
Step 1: Identify Market Structure
Determine whether the market is bullish, bearish, or ranging before analyzing an order block. This provides context for deciding which price zones deserve attention.
Step 2: Find Strong Price Movement
Look for a zone followed by a sharp and decisive price move. Strong displacement can indicate that the area had greater significance than ordinary price fluctuations.
Step 3: Confirm a Structure Break
Check whether the move from the zone broke a previous swing high or low. A meaningful structure break can provide additional confirmation that the zone matters.
Step 4: Wait for a Retest
Allow the price to return to the marked zone instead of entering immediately. Watch for rejection, momentum changes, or other evidence that buyers or sellers are responding.
Step 5: Define Risk Before Entry
Set the invalidation level and stop loss before taking the trade. Adjust position size according to your risk tolerance and the distance to the invalidation point.
What Makes an Order Block High-Probability?
Not every marked zone deserves the same level of attention. A stronger setup generally has supporting evidence beyond the candle pattern itself.
| Factor | What Traders Look For | Why It Matters |
|---|---|---|
| Market structure | Break or shift in the prevailing structure | Gives the zone directional context |
| Displacement | Strong movement away from the area | Shows meaningful price expansion |
| Liquidity | Nearby highs, lows, or obvious stops | Helps explain the surrounding price action |
| Retest | Price returns to the marked zone | Creates an opportunity to observe reaction |
| Confluence | Support from other price-action factors | Reduces dependence on one signal |
| Invalidation | Clear level where the setup fails | Helps define risk before entry |
This framework is more useful than simply counting how many zones an indicator identifies. Quality matters more than quantity.
How to Confirm an Order Block Before Trading
Order block trading needs to follow a proper process and not keep buying and selling as soon as price hits the colored rectangle. It becomes much more effective once it is aligned with the prevailing market environment and creates a distinct reaction.
Some of the considerations that traders might use before entering include:
- Market Structure: Determine if the order block fits the prevailing market structure of bullish/bearish.
- Strong Displacement: Search for a clear displacement out of the zone and not just a weak move in price.
- Liquidity Sweep: Determine whether price makes a close high/low around the zone before rejecting it.
- Retest Reaction: Determine whether rejection occurs when price retests the zone.
- Structure Change: Determine whether there is a breakdown of a relevant swing point.
- Risk/Reward Ratio: Ensure the set-up offers sufficient upside relative to risk.
However, there is no specific confirmation that will ensure that the order block stays in place. The idea is to consider the pertinent factors while remaining true to the trading plan.
Can Order Blocks Be Used With Other Indicators?
Yes. An order block indicator can be used in conjunction with other indicators as long as each tool plays a particular role.
Moving averages can show general directional trends, and the ATR can show average levels of volatility. Volume can explain the level of participation, and oscillators can help in analyzing momentum.
But using many indicators is not always beneficial for your strategy. When multiple indicators provide you with the same data, your chart will look too complex.
Common Mistakes When Using Order Block Indicators
Keep these common mistakes in mind when working with order block indicators to maintain a clearer chart, avoid weak setups, and make decisions based on market context rather than relying solely on automated signals.
- Marking Every Zone
- Entering on Touch Alone
- Ignoring the Higher Timeframe
- Moving the Invalidation Level
- Assuming the Indicator Shows Institutional Orders
- Overlooking Market Structure
- Using Too Many Confirmation Tools
- Ignoring Risk Management
Final Thoughts
Order Block indicators may help you in finding some possibly important price levels, but using the indicator does not mean you don’t have to analyze the market anymore. The labeled area will become more valuable for you if it is appropriate for the environment, has proper displacement, and gives a reaction confirming the initial trading idea.
No matter what you trade, be it a bullish or bearish set-up, analyzing the surroundings before trading should be considered.
Combining structured analysis with invalidation levels and proper position size can make your trading based on Order Blocks more practical.
The best way to use any indicator is not to get hundreds of signals from it. The best way to use an indicator is to organize price data, find interesting areas, and trade according to your rules.
FAQs
1. What is an order block indicator?
An order block is a chart indicator which helps to detect price levels where there might be considerable buying/selling going on. The indicator makes use of rules based on price structure and price displacement for detection of potential areas of interest.
2. Is an order block a guaranteed support or resistance level?
No, an order block is a potential area of interest and not necessarily a reversal level because price may pass through such a level depending on prevailing conditions.
3. What is the difference between a bullish and bearish order block?
A bullish order block usually comes with a significant price expansion upwards, whereas a bearish order block comes with a significant price move downwards. Traders take advantage of their own zones for the analysis of buy or sell reaction.
4. Can beginners use an order block indicator?
Beginners can use it as an educational tool and for analysis, but they need to be aware of the market structure, risk management, and indicators’ logic first. Automated signals are not to be considered as reliable trade signals.
5. How should traders confirm an order block?
These confirmations could take the form of things like structural changes in market, liquidity clean-up, momentum, displacement, or responses following a retest. It is crucial to establish and test what constitutes the right confirmation process prior to live trading.