The market doesn't often work in a purely random manner. Price tends to behave at the levels where there are large orders, stop losses, and buyers' or sellers' interests. The smart money principles allow us to analyze price behavior in terms of market structure and liquidity rather than depending on standard technical indicators.
Instead of seeing each price movement as a trading signal, smart money allows one to understand why prices moved, how orders were placed, and what may happen next. Getting an insight into such principles will allow traders to develop structured analyses and refrain from trading based on candles or signals.
The following guide contains seven key concepts of smart money.
What Are Smart Money Concepts?
Smart money concepts are a collection of price action indicators used to study how the activities of big market players can impact market movements. This concept studies the correlation between prices, liquidity, imbalances, and areas where the execution of big orders may have taken place.
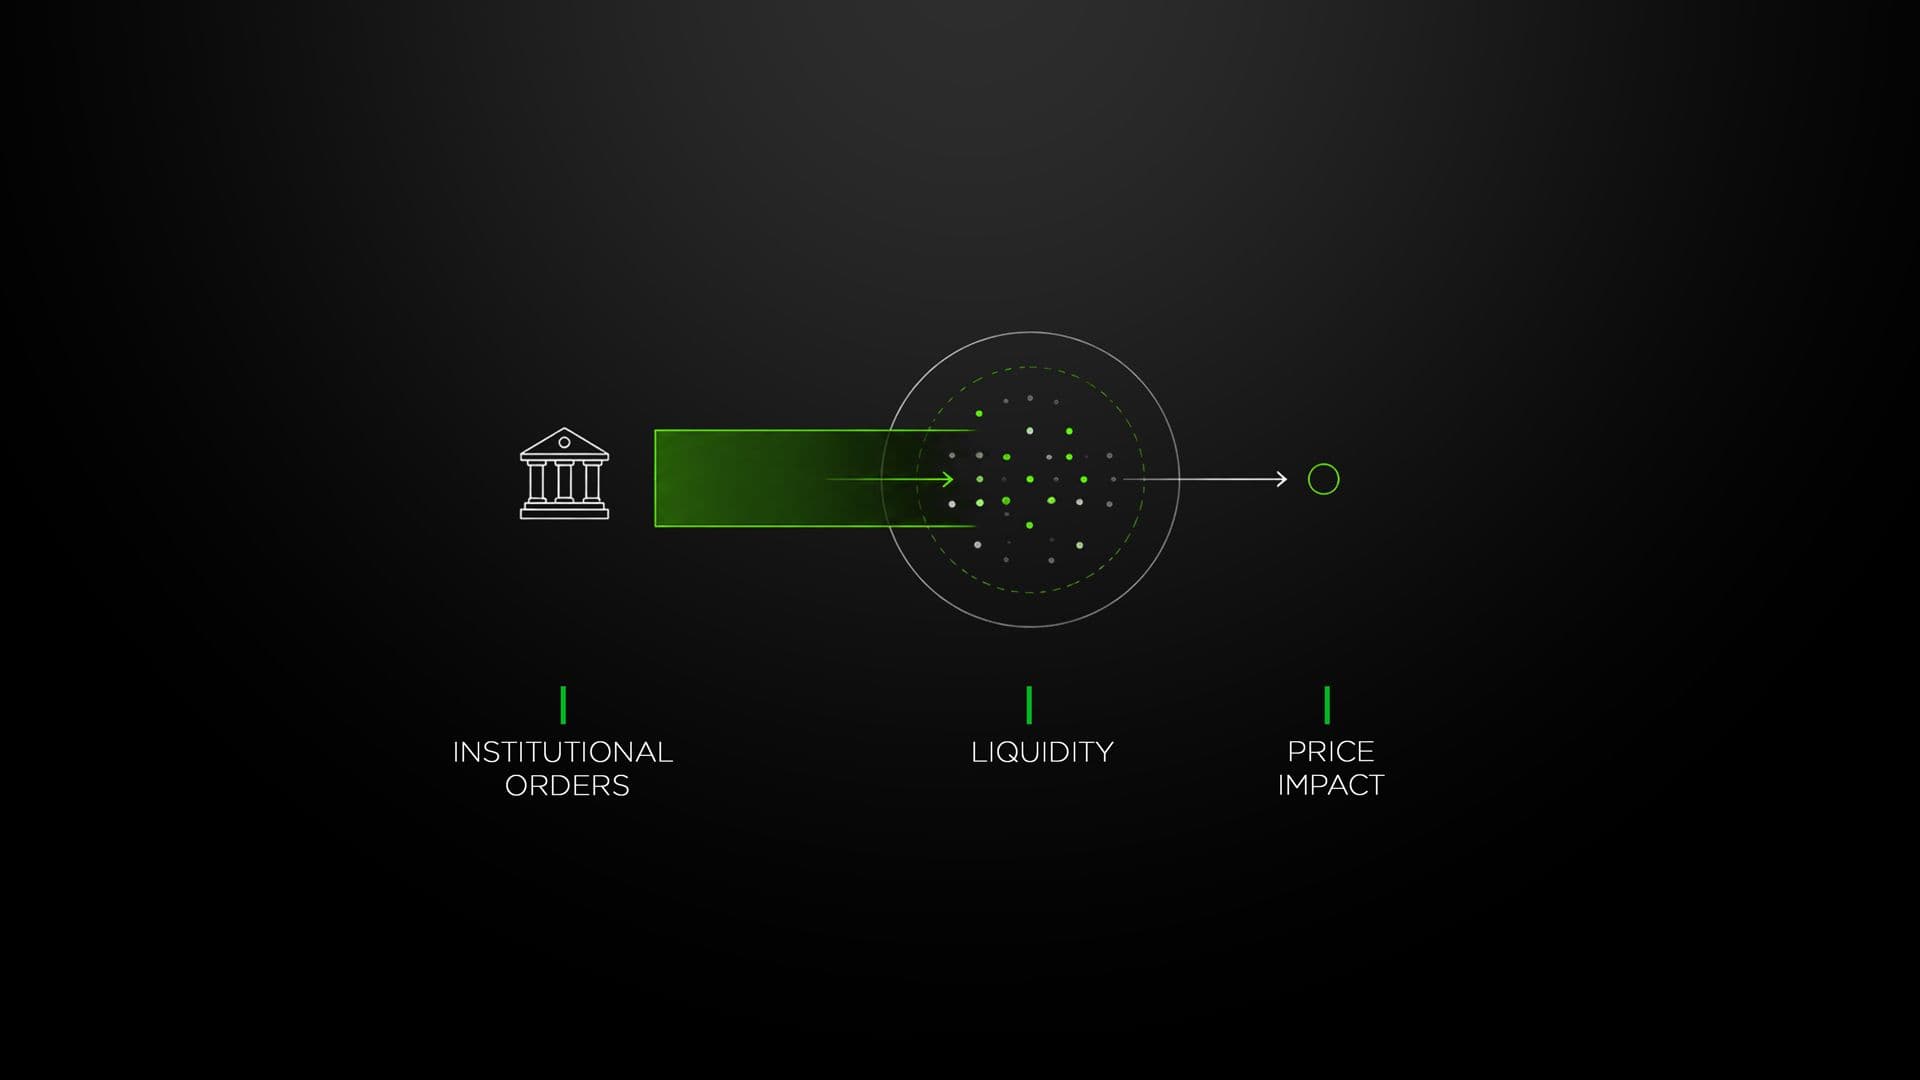
The smart money usually means big market players such as banks and funds. Yet, traders must not assume that a chart shows what the institutions are doing. The concepts should rather be seen as tools for analyzing price action.
The best use of these ideas is to take several factors into account.
7 Smart Money Concepts to Consider
As a trader, you should be aware of several factors to make your trade profitable. Here you will find all the important factors to consider:
1. Market Structure
Market structure serves as the base from which to understand price action. It will determine whether the market is trending with higher highs and higher lows, lower highs and lower lows, or ranging.
A trader can analyze the following:
- Higher highs and higher lows: usually indicative of an uptrend structure.
- Lower highs and lower lows: usually indicative of a downtrend structure.
- Structure breakout: an important price move beyond a structural point in the past.
- Change in character: a potential change in the way the price behaves.
For instance, when a market continues to form higher highs and higher lows, then breaks down from an important level of support, it may require further investigation. It doesn't necessarily mean that there is a reversal, but it shows that the previous structure is breaking down.
It allows traders to interpret individual candles in relation to their environment first.
2. Liquidity
Liquidity in trading refers to those areas where orders are more likely to cluster. Those areas could form near former highs, lows, support and resistance zones, and many other places that draw traders' attention.
One such concept is a liquidity sweep, which is when price temporarily breaches a clear high or low point only to reverse to its prior range.
Traders can look for:
- Highs and lows that are equal
- Previous day’s highs and lows
- Swing points
- Range edges
- Clusters of obvious stop-loss points
What matters is that the movement in liquidity does not mean manipulation or reversal on its own; it needs to be confirmed by later price action.
3. Order Blocks
Order blocks are price zones that traders connect with considerable buy or sell pressure prior to an important market move. These can be found near the last counter-directional candlestick or price zone before an impulsive move.
One can consider the bull order block following a powerful move up, and the bear order block before an important move down.
Instead of creating many zones in the chart, the trader needs to analyze zones that are in some sort of relation to market structure.
Practical criteria might include:
- Spot a strong directional move.
- Find the price area where it occurs.
- Did the move affect or confirm market structure?
- See what happens when price gets back to that area.
- Order blocks, therefore, should be considered as a zone rather than an entry point.
4. Fair Value Gaps
Fair value gaps refer to price discrepancies that can be witnessed whenever the market is moving extremely fast in one particular direction. Such price gaps are often identified using a three-candle pattern in which the wicks of the first and third candles fail to overlap each other.
These kinds of price gaps are significant since price expansion can leave very limited trading volume in certain parts of the gap area.
But not all gaps get filled, and simply returning to a gap doesn’t imply a reversal of price action.
For a better understanding, we have to consider:
- The trend in the higher structure
- The position of the gap
- The liquidity near the level
- Momentum of the original move
- Price behavior on retracing to the level
This makes the indicator far more practical as a component of a setup as opposed to a stand-alone prediction tool.
5. Break of Structure
A break of structure happens when the price moves outside of a previous swing level. This is useful because it can help confirm whether the current structure is about to continue or shift.
As an example, when there is an uptrend in place, if the price breaks above a previous swing high, this is confirmation that the structure is likely to continue.
It is important to emphasize the significance of that level. A small movement within the day does not have to hold the same significance as an established swing point.
Traders will be able to analyze their situation better when they ask themselves:
- Was that level significant?
- Was there a breakout from it with the price closing above?
- Was there momentum involved?
- What happened next?
This prevents every small price breach from being classified as a major structural event.
6. Premium and Discount Zones
Premium and discount zones offer a mechanism for measuring the position of the price in a specified range.
Once the significant high and the significant low have been found, one can split the range into an upper and a lower part. The upper part is generally considered premium, whereas the lower part is considered a discount.
The basic idea is straightforward:
- Discount: potentially more favorable location for examining long setups.
- Premium: potentially more favorable location for examining short setups.
- Equilibrium: the approximate midpoint of the selected range.
They are not determining the direction on their own. The market can be in a premium zone and continue going up, or be in a discount zone and keep falling.
The power of the zones lies in their combination with the structure, liquidity, and other confirmations.
7. Displacement and Strong Price Expansion
Displacement refers to a strong price movement that moves away from a location that shows significant momentum. Huge candle bodies, little retracement, and fast movements show that the market has made a strong move.
Displacement assists traders in knowing whether there is a movement that is meaningful rather than just market noise.
For instance, when price breaks out of a structural level showing strong momentum and leaves an imbalance, the breakout offers more useful information than a weak breakout that is composed of several smaller candles.
However, traders need to take into consideration the bigger picture, because when a strong move is towards a major resistance or towards the nearby liquidity, it would create a different setup.
How These Concepts Work Together
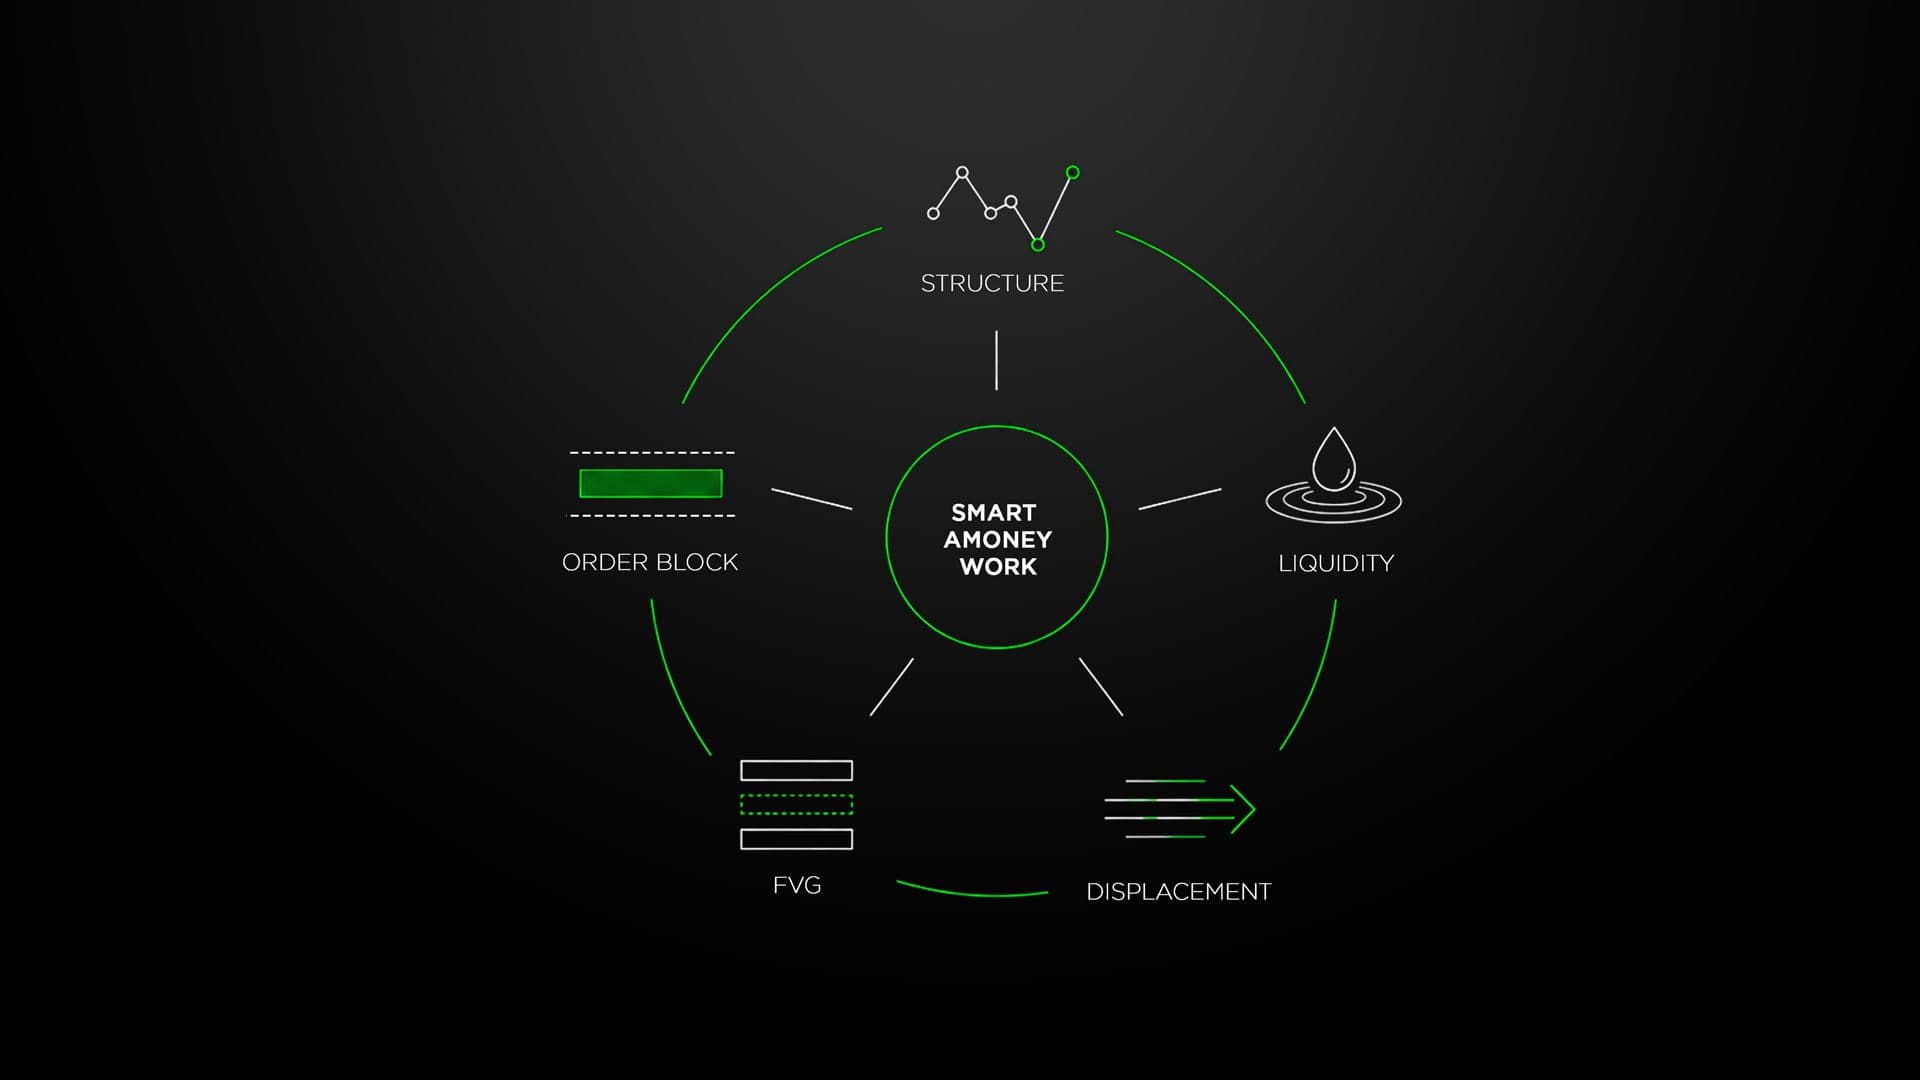
The seven concepts become more useful when they are connected rather than studied independently.
| Concept | What It Helps Identify | What to Look For |
|---|---|---|
| Market structure | Overall price direction | Highs, lows, structural shifts |
| Liquidity | Areas containing concentrated interest | Equal highs/lows, swing points |
| Order blocks | Potential reaction zones | Strong move from a defined area |
| Fair value gaps | Price imbalance | Rapid three-candle expansion |
| Break of structure | Possible continuation or shift | Meaningful swing-point break |
| Premium/discount | Price location within a range | Upper, lower, and midpoint areas |
| Displacement | Strength behind a move | Rapid expansion and momentum |
A potential setup might begin with a clear structural trend, followed by a liquidity sweep. Price could then show displacement, leave a fair value gap, and return toward an order block. This combination provides a much richer context than any individual pattern.
Common Mistakes When Using Smart Money Concepts
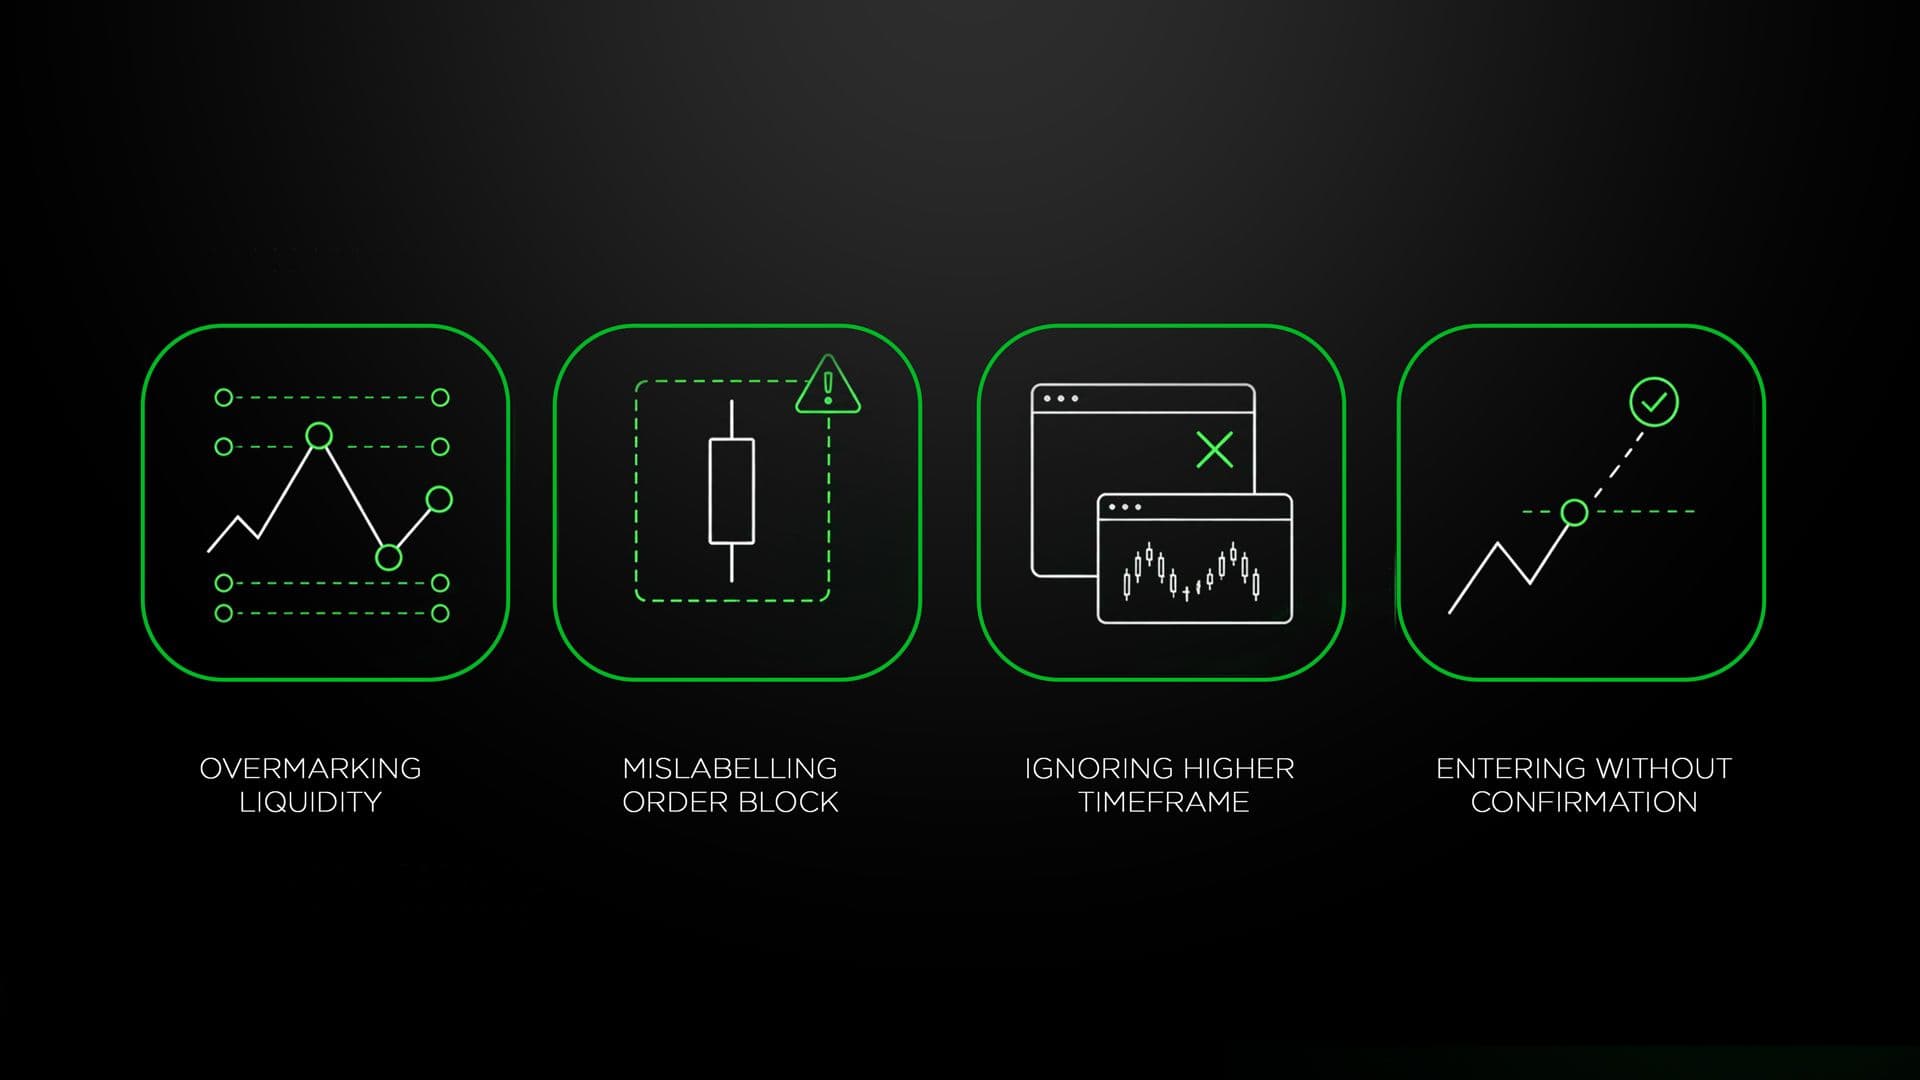
These ideas can become confusing when traders try to apply every concept to every chart. Common mistakes include:
- Marking every minor high and low as liquidity
- Treating every candle as an order block
- Assuming every fair value gap must be filled
- Calling every price reversal a liquidity sweep
- Ignoring the higher-timeframe structure
- Entering immediately without confirmation
- Using too many zones until the chart becomes cluttered
- Treating institutional behavior as something that can be known with certainty
A cleaner chart with a few meaningful levels is often more useful than one covered with dozens of annotations.
Final Thoughts
Smart money concepts can provide traders with a disciplined approach for analyzing price movement through market structure, liquidity, imbalance, and important reaction levels. The most powerful feature of these concepts is their ability to assist traders in organizing information rather than providing a tool for predicting all the market's movements.
It is recommended to begin with an analysis of market structure and liquidity, then proceed to more complicated concepts like order blocks and fair value gaps. As soon as price action starts becoming clear, these concepts can be used for building a consistent analysis system. However, the key is to analyze these patterns together with appropriate risk management and trading rules.
FAQs
1. Are smart money concepts suitable for beginners?
Yes. Beginners can learn those too, but it would be best if they start off learning about the basic market structures first because it will make understanding the complex ideas easier for them in the long run.
2. What is the most important smart money concept?
Market structure would be a good point to start from, since all other aspects will get some additional meaning when viewed against the background of price structure.
3. Are order blocks guaranteed support or resistance?
No. An order block is a place for analysis, not a reaction zone. Price may go through it; therefore, it is necessary to set certain confirmation and invalidation criteria.
4. Do fair value gaps always get filled?
No. Others continue to exist partially or wholly while the price continues to move along its previous path. A value gap will thus have to be taken into consideration in relation to market structure and price movements.
5. Can smart money concepts be used with other indicators?
Yes. Traders can also use price action in combination with tools like moving averages, volume, or momentum indicators. But just because traders use additional tools doesn’t necessarily mean that they will be beneficial for a strategy.