The supply demand zones allow the traders to find regions on the chart where previous buying/selling pressure was enough to impact the prices. Rather than looking for one level of support/resistance, traders look for larger price regions which can again impact the market.
However, they can prove to be very helpful while looking for possible reversals, continuations, and places where your trading idea could turn out to be invalid. But you should not consider a zone to be an automatic point of entry just yet.
If one is aware of how these zones develop, how one determines their strength and how they interact with confirmation, then it is easier for one to make chart interpretation systematic.
What Are Supply Demand Zones?
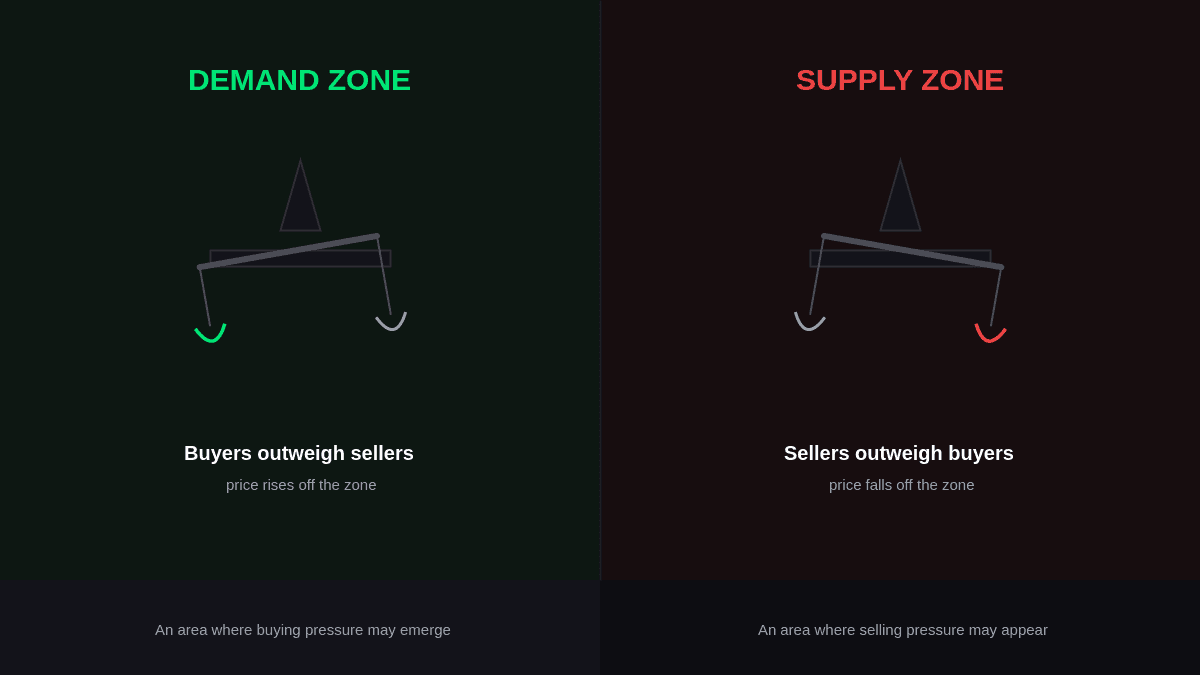
Supply demand zones are price areas that have experienced an imbalance of supply and demand. A demand zone will be formed if the buying activity has been intense enough in the past to cause price to rise, and a supply zone will form when price falls because of selling activity.
As opposed to the horizontal level, zones occupy certain areas, not one particular price point. This allows greater freedom in evaluating reactions of prices.
The basic idea is straightforward:
- Demand zone: An area where buying pressure may emerge.
- Supply zone: An area where selling pressure may appear.
- Zone reaction: Price responds after returning to the area.
- Zone failure: Price moves decisively through the area instead of reacting as expected.
It’s not about predicting all the reversals; rather, zones help identify places where there may be a change in the balance between buyers and sellers.
How Supply Demand Zones Form
Zone formation is linked to events taking place right before a sharp price move. Traders normally seek consolidation or indecision in terms of price range followed by a sharp move in one direction.
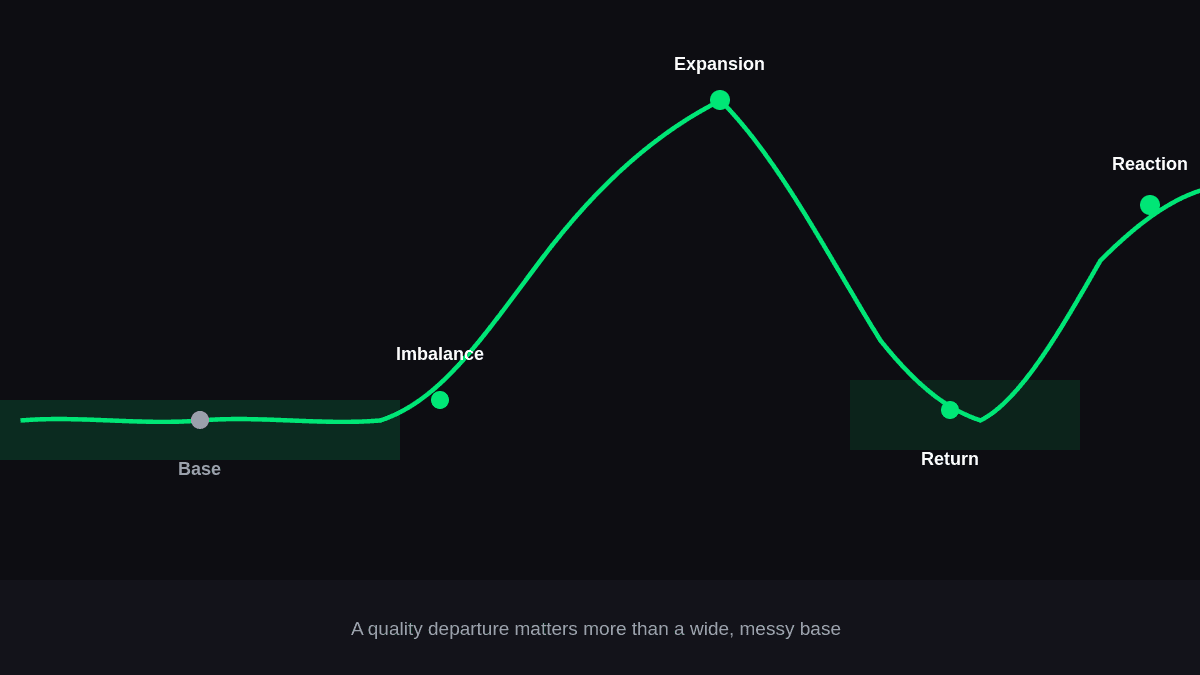
In case of a demand zone, prices might spend some time consolidating before the buyers take charge and make a sharp move upwards. In case of a supply zone, a similar consolidation might occur before the sellers make a sharp decline.
A simplified formation process is:
1: Base: Price pauses or consolidates within a relatively narrow area.
2: Imbalance: Buyers or sellers gain a noticeable advantage.
3: Expansion: Price moves strongly away from the base.
4: Return: Price later comes back toward the original area.
5: Reaction: Traders observe whether the market responds to the zone.
Quality is essential in making the first move. It’s better to have a strong start away from the base than a weak one with poor continuation.
How to Identify Strong Supply Demand Zones
Not every visible area on a chart deserves equal attention. A stronger zone usually has several characteristics that distinguish it from ordinary consolidation.
Look for a Strong Departure
A sudden divergence from the base suggests that one party of the market has taken charge. The stronger the imbalance, the more significance the original area takes.
Examine the Base
A clear and fairly compact base will make definition of the area easier. An extremely broad or chaotic consolidation process may give you less accurate results.
Check Previous Reactions
In case the price comes back to the level and responds, then this is also some confirmation. But when the price comes back again and again, then the level will become weaker.
Consider the Broader Trend
The zone cannot be considered in isolation. The demand zone in the downtrend will act differently than the one in agreement with the bullish pattern.
Assess the Departure-to-Base Relationship
A strong move emerging from a small, well-defined base can be more informative than a slow movement developing from a large and irregular range.
Supply Zone Trading vs. Demand Zone Trading
The two sides of the concept are related, but their practical interpretation differs. Below you will find a proper comparison to understand it better in detail:
| Feature | Supply Zone Trading | Demand Zone Trading |
|---|---|---|
| Market pressure | Selling pressure | Buying pressure |
| Expected reaction | Potential downward movement | Potential upward movement |
| Typical location | Near areas preceding strong declines | Near areas preceding strong advances |
| Main observation | Rejection or bearish continuation | Supportive reaction or bullish continuation |
| Possible invalidation | Price establishes itself above the zone | Price establishes itself below the zone |
| Common objective | Lower price area or opposing demand | Higher price area or opposing supply |
The table highlights an important point: traders are not simply looking for red or green candles. They are examining how price behaved around a particular area and whether the current market context supports that interpretation.
A Practical Method for Mapping Zones

Charts can contain many potential areas, so a consistent process helps prevent over-analysis. Here you can find a proper 5 steps guide to follow:
1. Start With a Higher Time Frame
Start from a larger chart for the understanding of the market structure. Zones of higher time frames may be helpful prior to your search in smaller charts.
2. Mark Significant Bases
Find the regions before any directional trend occurred. Do not point out each minor consolidation as this will clutter your chart with unnecessary areas.
3. Refine the Boundaries
Use the price action around the base to establish a reasonable upper and lower boundary. The goal is to capture the meaningful area without making the zone unnecessarily wide.
4. Move to a Lower Time Frame
Once broader areas are identified, a lower time frame can help you study the reaction in greater detail. This may reveal rejection, momentum shifts, or changes in market structure.
5. Wait for Confirmation
Just because someone revisits the zone doesn’t necessarily mean they have a valid trade set up. Make sure there is proof of participation before setting up a trade.
Using Price Action for Confirmation
Supply and demand trading becomes more practical when zones are treated as areas for observation rather than automatic signals.
Confirmation can take several forms:
- Strong price rejection: Price may reject the zone with a noticeable wick.
- Reversal pattern: A clear reversal formation can indicate that buyers or sellers are responding to the area.
- Swing point break: Price may break a nearby swing high or low, providing additional confirmation.
- Short-term structure shift: A change in market structure can support the idea that momentum is moving away from the zone.
- Volume confirmation: When reliable volume data is available, a noticeable increase in activity around a reaction may strengthen the case for further investigation.
Volume should not be interpreted independently, as higher activity does not automatically confirm a successful reversal.
The key principle is simple: the zone creates the location; price action helps evaluate the reaction.
Entry, Stop-Loss, and Target Planning
A zone is made more useful if the trader has already determined how the trade will be controlled.
The entry can now be placed when the price touches the particular zone and gives confirmation according to the trading approach of the trader. Some traders enter trades near the zone while some wait for a structural breach or test.
Placement of stop loss should be done at the point where the initial trade idea becomes invalid rather than placing the stop loss some arbitrary distance away. For instance, a demand zone becomes invalid when the price breaches the zone.
Targets can be selected using nearby swing highs, swing lows, opposing zones, or predetermined risk-to-reward requirements.
Before entering, traders should be able to answer three questions:
- Where does the trade become invalid?
- Where is the logical profit objective?
- Does the potential reward justify the risk?
How to Improve Zone Analysis
Analysis is achieved by being consistent rather than creating more and more indicators. This could be done by documenting the reasons for each zone and the reactions when price comes back into this zone.
A trading journal can track:
- Time frame of the zone
- Reason for identifying the area
- Strength of the initial departure
- Number of previous tests
- Confirmation observed on the retest
- Entry and invalidation point
- Final trade outcome
Over time, reviewing this information can help identify those traits that are really helpful to that specific approach.
Common Mistakes When Using Zones
Even a well-marked zone can produce a losing trade. Avoiding common mistakes helps traders use supply and demand zones more effectively and maintain a clearer trading plan.
- Treating every base as important
- Entering without confirmation
- Ignoring market structure
- Making zones too wide
- Assuming a zone lasts forever
Conclusion
Supply demand zones can serve traders a framework within which they can analyze price movements formed by a previous supply or demand pressure. It is valuable in relation to the context of the zone formation rather than treating any identified zone as some kind of a signal.
Great analysis requires the combination of zone quality, market structure, price action, confirmation and proper risk management. Traders need to be aware that not all zones are guaranteed to elicit reactions. Testing the process and looking at historical results will allow traders to identify the key aspects of zones.
FAQs
1. What are supply demand zones in trading?
The supply demand zones are defined by zones of prices that have been affected significantly in the past by buyers or sellers.
2. How do you identify a strong demand zone?
Find a relatively clear base with a good uptrend thereafter. Others include the power of the breakout, the structure of the market, and the way prices react to coming back to that region.
3. How do you identify a supply zone?
A supply zone is typically formed in the area surrounding a base prior to a substantial downtrend move. The traders will watch the area for any possible selling pressure as prices go up.
4. Can supply and demand zones fail?
Yes. The zone can be considered a failed one because the price breaks out of it rather than responding to it. Various factors can play a part in the failure of the zone.
5. Are supply demand zones better than support and resistance?
Both methods are not better than one another. The supply and demand method highlights the regions that can be linked with market imbalance, whereas support and resistance emphasize the repetitive prices.