The quality of your analysis depends heavily on the trading data behind it. A strategy may look profitable after a few successful trades, but a small sample cannot tell you whether those results are repeatable or simply the result of favorable market conditions.
Knowing when you have enough information is therefore an important part of evaluating a trading approach.
Having more records does not automatically make your analysis better. The usefulness of a dataset depends on factors such as the number of observations, market conditions covered, consistency of the records, and whether the data represents the way you actually trade.
The goal is to reach a dataset that is broad and reliable enough to validate trading strategies and support meaningful conclusions.
In this blog, we will explore what makes a trading dataset sufficient and how you can evaluate whether you have enough information.
What Does Trading Data Mean?
Trading data refers to the information recorded about market activity and individual trades.
Depending on your strategy and research goals, it can include price movements, trade entries and exits, volume, timestamps, position sizes, profits and losses, and other market variables.
The type of data you need depends on what you are trying to measure. A short-term strategy may require detailed intraday information, while a longer-term approach may rely on daily or weekly observations.
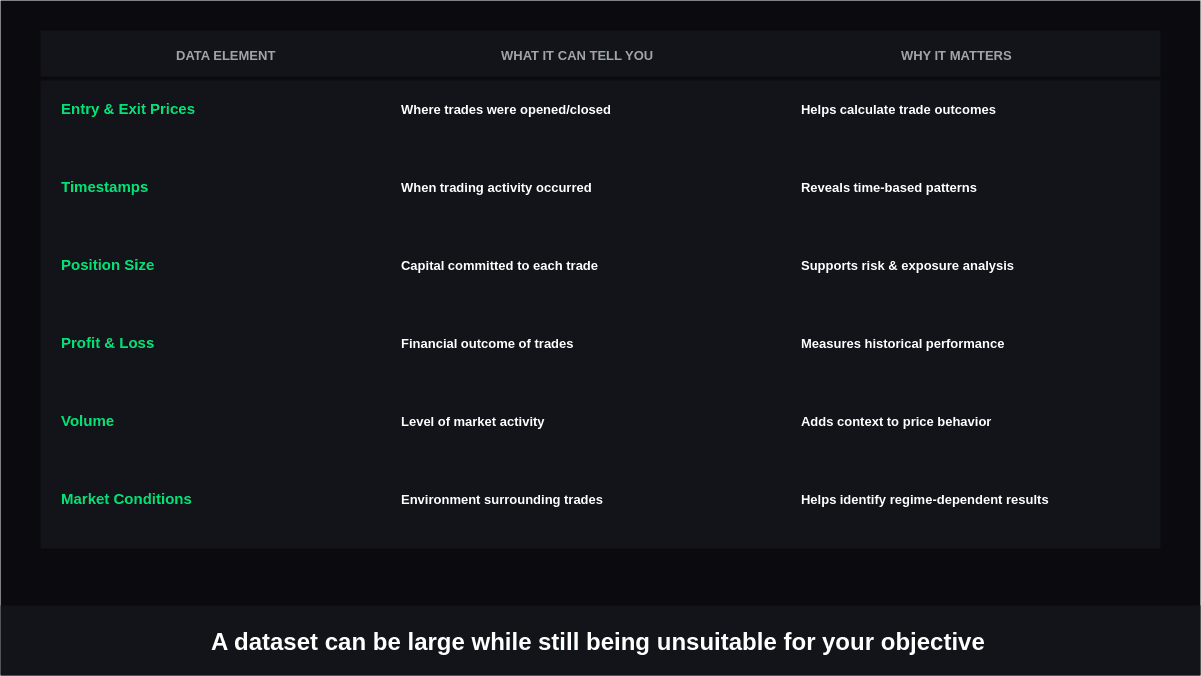
| Data Element | What It Can Tell You | Why It Matters |
|---|---|---|
| Entry and exit prices | Where trades were opened and closed | Helps calculate trade outcomes |
| Timestamps | When trading activity occurred | Reveals time-based patterns |
| Position size | Capital committed to each trade | Supports risk and exposure analysis |
| Profit and loss | Financial outcome of trades | Measures historical performance |
| Volume | Level of market activity | Adds context to price behavior |
| Market conditions | Environment surrounding trades | Helps identify regime-dependent results |
A dataset can therefore be large while still being unsuitable for your objective. For example, thousands of trades from only one type of market environment may provide less useful evidence than a smaller but more representative sample.
7 Steps to Know If Your Trading Data Is Sufficient
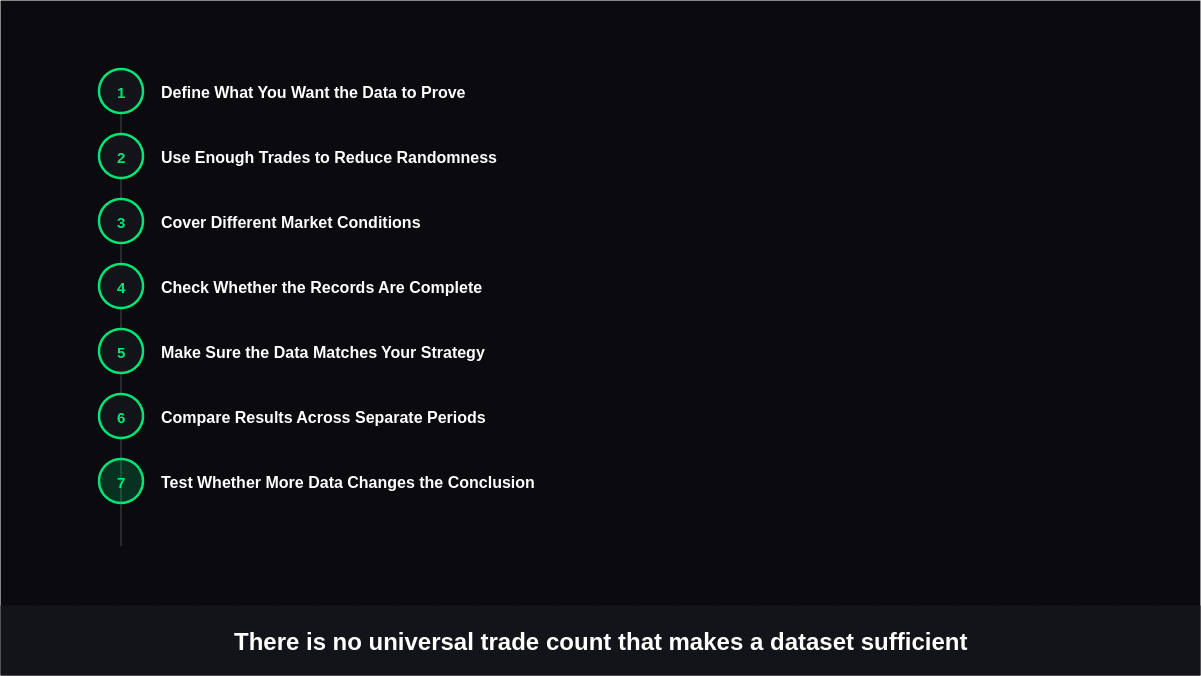
There is no universal number of trades that automatically makes a dataset sufficient. Instead, assess the information from several angles. The following steps can help you determine whether your records provide enough evidence for the question you want to answer.
1. Define What You Want the Data to Prove
Before counting trades, establish the specific question your analysis needs to answer.
1: Are you checking whether a strategy has historically produced consistent results?
2: Are you testing a particular entry rule?
3: Are you evaluating risk and drawdowns?
Your required dataset can vary considerably depending on the objective.
- Define the exact hypothesis you are testing.
- Identify the metrics that will determine success or failure.
- Decide whether you need trade-level, price-level, or portfolio-level information.
- Avoid collecting data without a clearly defined analytical purpose.
A dataset is only sufficient relative to the question being investigated.
2. Use Enough Trades to Reduce Randomness
A handful of winning trades can create an attractive performance record, but short samples are highly vulnerable to random outcomes. One unusually large gain or loss can significantly change the overall results.
Rather than focusing on an arbitrary trade count, examine whether the sample is large enough for individual outcomes to have less influence on your conclusions.
- Count completed trades rather than planned setups.
- Review the distribution of wins and losses.
- Look for unusually influential individual trades.
- Compare results across different portions of the sample.
The objective is not simply to accumulate a large number of transactions. It is to obtain enough observations that the overall pattern is not dominated by a few events.
3. Cover Different Market Conditions
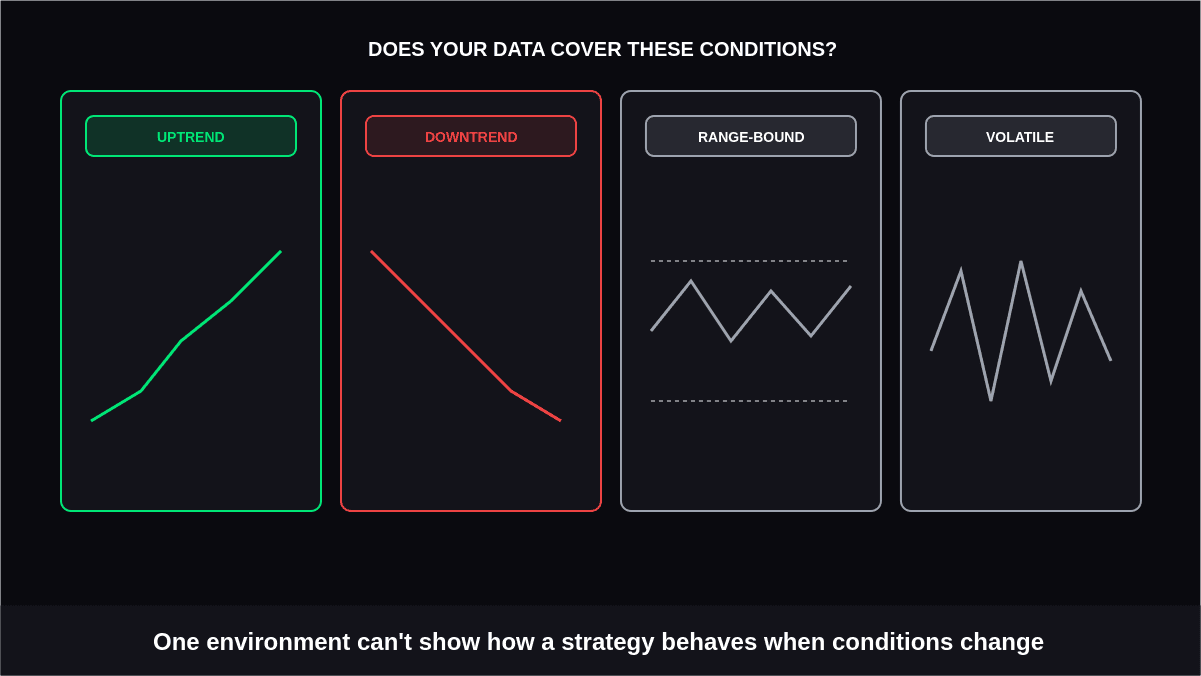
A strategy can behave differently during trending, ranging, volatile, and quiet markets. If your records cover only one environment, you may not know how the approach behaves when conditions change.
This is where historical trading data can become particularly useful. A longer historical period can expose the strategy to different market phases, provided the underlying information is consistent and relevant.
Consider whether your dataset includes:
- Strong upward and downward trends
- Sideways or range-bound periods
- Higher-volatility sessions
- Lower-volatility environments
- Significant market disruptions where relevant
Broader market coverage can make your analysis more informative than simply increasing the number of observations from the same conditions.
4. Check Whether the Records Are Complete
A large dataset with missing or inconsistent information can produce misleading conclusions. Before analyzing performance, inspect the records for gaps, errors, and irregular formatting.
Important checks include:
- Missing entry or exit prices
- Incorrect timestamps
- Duplicate transactions
- Missing fees or transaction costs
- Inconsistent position-size records
- Incorrectly recorded wins or losses
- Gaps in the underlying market data
This is a central part of data quality in trading. Cleaning the dataset may reduce the number of usable observations, but the remaining information can be more dependable for analysis.
5. Make Sure the Data Matches Your Actual Strategy
Your dataset should represent how the strategy is actually executed. Using information that would not have been available when a historical trade occurred can distort the results.
For example, if you normally trade during specific hours, testing the strategy across an unrelated session may not provide an accurate representation of your process.
Check that your dataset reflects:
- The instruments you actually trade
- Your usual timeframe
- Entry and exit rules
- Trading hours
- Position-sizing methods
- Relevant transaction costs
- Execution assumptions
This step prevents a dataset from appearing sufficient simply because it contains a large quantity of information that does not match your trading process.
6. Compare Results Across Separate Periods
A dataset can appear convincing when analyzed as one continuous block. Splitting it into separate periods can reveal whether the observed results are reasonably consistent.
For instance, divide the records into earlier and later periods and compare important measures rather than relying on one overall figure.
Look at:
- Win rate
- Average gain and loss
- Maximum drawdown
- Profit factor
- Number of trades
- Performance by market environment
This approach can contribute to more meaningful trading performance analysis because it shows whether the observed behavior persists across different sections of the dataset.
7. Test Whether More Data Changes the Conclusion
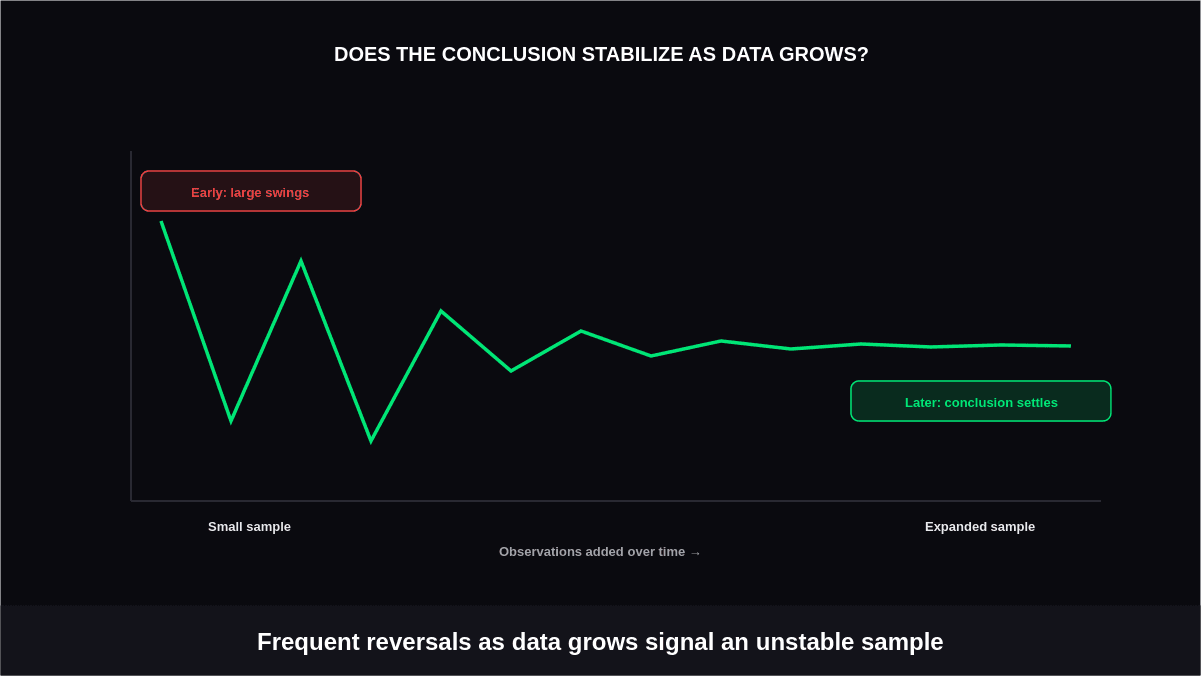
One practical way to assess sufficiency is to examine what happens as you add more observations. If the key conclusions change dramatically whenever additional data is included, the original sample may not have been stable enough.
For example, you might compare results after progressively expanding the historical period.
- Record the important performance metrics.
- Add another segment of relevant observations.
- Recalculate the same metrics.
- Note whether major conclusions change.
- Investigate significant shifts rather than automatically dismissing them.
If additional relevant data produces increasingly stable conclusions, you have stronger evidence that your dataset is becoming useful for the intended analysis.
How to Judge Data Sufficiency
Use the following framework before relying heavily on your results:
| Question | Stronger Evidence | Potential Warning |
|---|---|---|
| Is the sample broad? | Multiple relevant market periods | One narrow period |
| Are records complete? | Consistent, verified fields | Missing or duplicated entries |
| Are conditions varied? | Different market environments | One dominant regime |
| Does it match your strategy? | Same instruments and execution rules | Mismatched assumptions |
| Are results stable? | Similar patterns across periods | Large unexplained changes |
| Does added data help? | Conclusions become more consistent | Conclusions frequently reverse |
Conclusion
Knowing when your trading data is sufficient requires more than reaching a specific number of trades. You need enough relevant observations, reliable records, varied market conditions, and data that accurately represents the strategy being evaluated. These factors provide a stronger foundation for interpreting historical results.
Before drawing conclusions, define your objective, examine the sample size, check data quality, evaluate different market environments, and compare results across separate periods.
If additional relevant information continues to change the outcome substantially, your analysis may need a broader dataset. Taking this approach can help traders apply how to analyze backtest results more systematically and reduce conclusions based on limited evidence.