Trading strategy benchmarks are reference points used to evaluate how effectively a trading strategy performs relative to a relevant market, index, alternative strategy, or predefined target. Instead of looking at profits alone, traders can compare returns, consistency, volatility, costs, and downside risk.
A useful benchmark should match the strategy's market, timeframe, objectives, and risk profile. This makes it easier to determine whether performance reflects genuine strategy value or simply favorable market conditions.
In this blog, you’ll learn how to choose relevant trading strategy benchmarks, measure performance, and compare returns with risk, consistency, and drawdown.
What Are Trading Strategy Benchmarks?
A trading strategy benchmark is a yardstick that provides a way to evaluate the performance of the strategy in relation to the opportunities, risks, and other factors that it encounters.
For instance, if a trading strategy earns a 15% gain within a year, it does not necessarily mean that the performance was impressive because the market might have appreciated by 25%, or the trading strategy has done better than the market without taking too much risk.
Benchmarking allows one to ask an important question:
Whether the performance of the strategy was satisfactory under the circumstances?
This might be compared to a market index, a passive buy and hold strategy, or any other systematic trading strategy.
There is no universal benchmark for all trading strategies. The most suitable benchmark will depend on the intended objective of the trading strategy.
Why Do Trading Strategies Need Benchmarks?
Performance cannot be judged without a benchmark.
A winning strategy looks very attractive during good market conditions even when the success achieved is primarily due to market conditions. Likewise, the strategy that earns moderate gains in a bad market condition is quite successful if it has reduced losses and managed risk effectively.
The use of a benchmark helps evaluate performance in several ways:
- Whether returns are competitive with an appropriate alternative
- Whether additional returns justify additional risk
- Whether performance is consistent across different periods
- How severely the strategy declines during losing periods
- Whether trading costs materially affect profitability
- Whether results depend heavily on a particular market environment
The purpose is not necessarily to beat the benchmark every month but to make the reasons behind the performance understandable through the benchmark.
What Should You Measure When Benchmarking a Strategy?
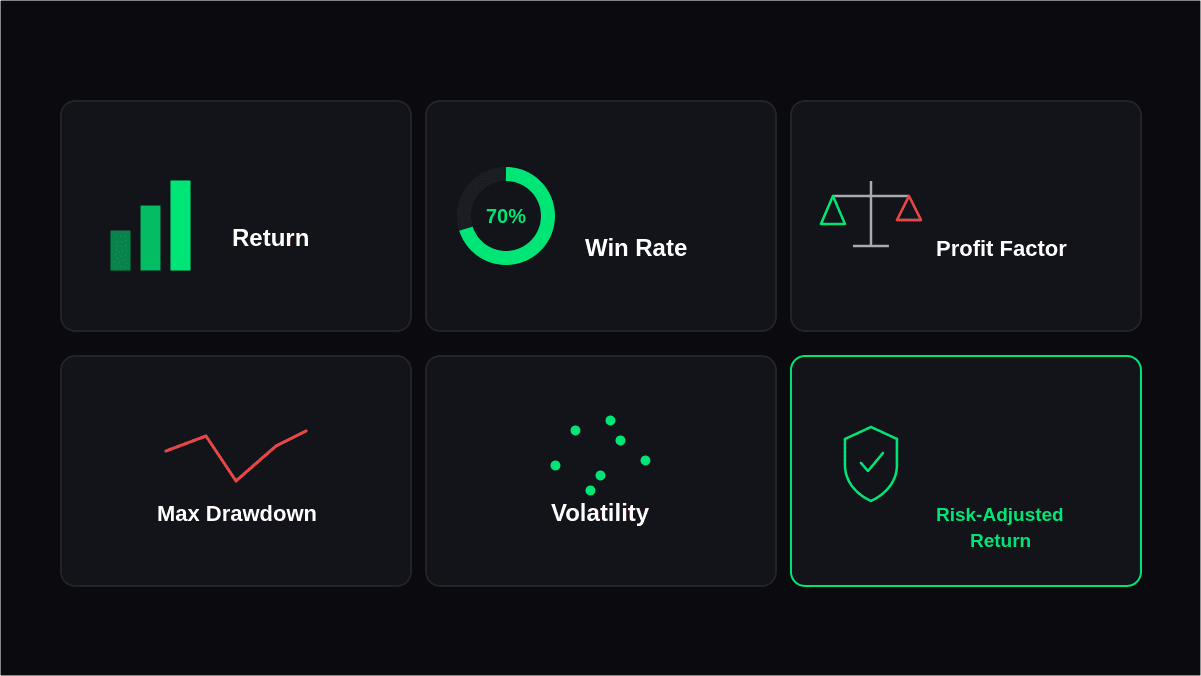
Making profits is vital, but it's just one of the criteria that need to be evaluated comprehensively. Traders need to look at several indicators of their trading success rather than just one indicator.
Return
The Return measures the gains and losses that were made by the strategy over a certain time period.
But returns must always be evaluated in conjunction with the timeframe and risk taken. For example, a 10% return made in one month and 10% in three years is entirely different situations.
Win Rate
Win rate refers to the percentage of trades that are closed successfully.
A high win rate does not necessarily mean that a strategy works well. The strategy might win often but still result in losses if its losers are substantially bigger than its winners.
Profit Factor
Profit factor shows the relationship between gross profits and gross losses. It offers another method of assessing whether a strategy had winning trades that were historically bigger than the losers.
Maximum Drawdown
Maximum drawdown measures the biggest drop from the high point to a lower point in a portfolio or strategy during a certain period of time.
It is especially useful because two strategies that have comparable returns will definitely have very different paths along the way.
For instance, a strategy that yields 20% with a 10% drawdown is probably easier to deal with than a strategy that produces 25% with a 40% drawdown.
Volatility
The level of volatility determines the extent of return variation.
High levels of volatility do not imply poor performance in terms of negative aspects, but they can affect management and can be seen as the level of high risk involved.
Risk-Adjusted Returns
Performance measured by risk-adjusted returns looks at the performance and at the same time looks into the risk taken in order to generate the performance.
Ratios like the Sharpe ratio and the Sortino ratio can help in gaining insight into different strategies having varying levels of volatility and downside risk.
It is not the intention to pick a strategy based on one ratio.
To maintain baseline protection during volatile periods, utilizing built-in risk management tools like ATR-based dynamic stop-loss and take-profit levels ensures drawdowns stay within planned benchmarks.
How to Choose an Appropriate Benchmark
There should be a logic that relates the benchmark to the strategy under evaluation.
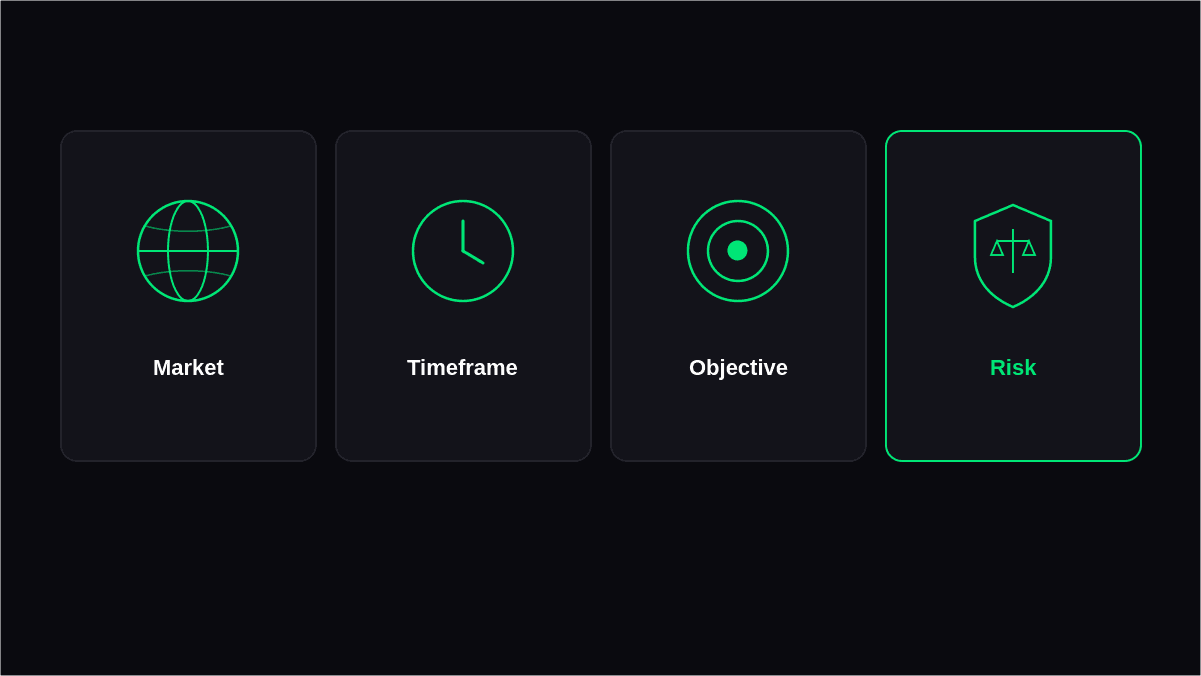
Match the market
For a strategy that is trading large cap stocks in the United States, a benchmark of equity will make more sense than one that is outside the equity realm.
The closer the benchmark is to the opportunity set of the strategy, the more meaning is found in the comparison.
Match the timeframe
A day trading strategy cannot necessarily use the same set of assumptions as a long term investment strategy.
The short-term strategy is highly influenced by such factors as execution, spread, slippage, and frequency of trades.
Consider the strategy's objective
Not every strategy is designed simply to maximize returns.
A strategy may aim to:
- Reduce downside
- Generate income
- Diversify a portfolio
- Capture trends
- Exploit short-term price movements
- Maintain lower volatility
The benchmark should reflect the strategy's actual purpose.
Account for risk
Risk-free benchmarking can yield flawed results.
In case one method gives higher profits, but suffers from considerably larger losses compared to the other, then the comparison of returns alone can give misleading results about the superiority of the high return method.
Strategy Benchmarking by Trading Style
Different trading styles require different evaluation approaches.
| Trading Style | Useful Comparison Areas |
|---|---|
| Day trading | Profit per trade, drawdown, execution costs, consistency |
| Swing trading | Return, holding period, drawdown, market exposure |
| Trend following | Market-relative return, volatility, losing periods |
| Mean reversion | Win rate, average trade, drawdown, regime sensitivity |
| Long-term systematic | Annualized return, volatility, drawdown, risk-adjusted return |
| Algorithmic trading | Out-of-sample performance, costs, stability, robustness |
This prevents traders from applying a benchmark designed for one type of strategy to a completely different approach.
How to Benchmark a Strategy Step by Step
A consistent process makes benchmarking more useful.
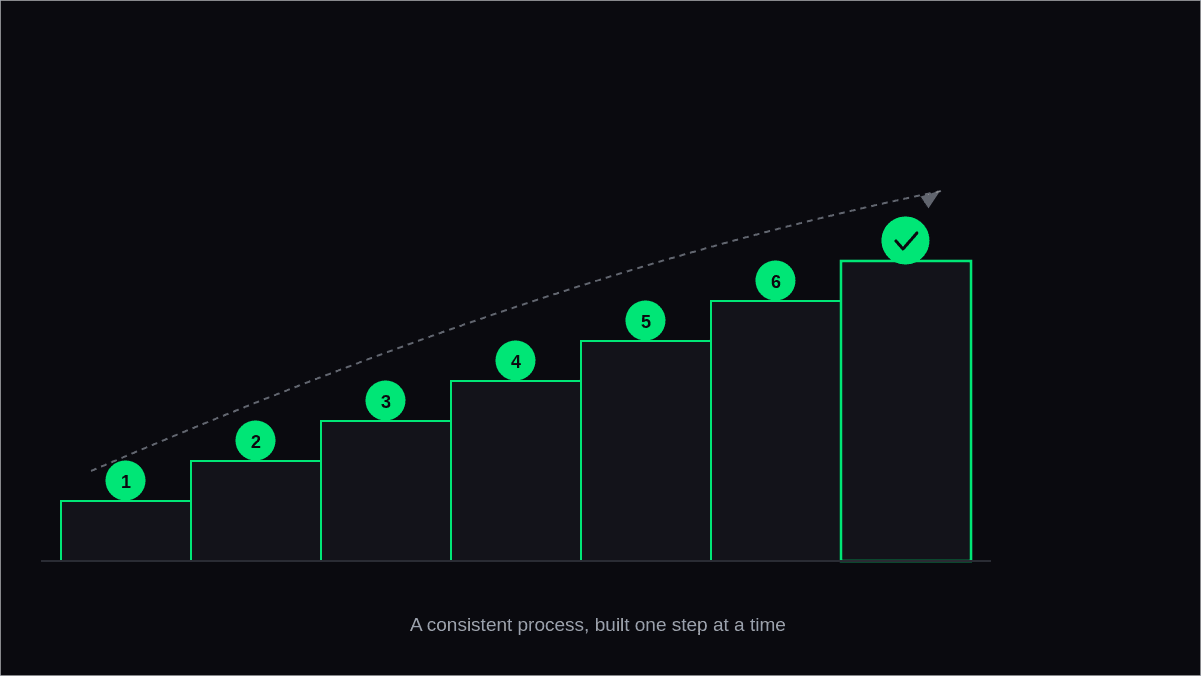
Step 1: Define the evaluation period
Select an interval that is long enough to provide valuable insights.
In case it is possible, it should include various market situations, but not test on either an exceptionally strong or weak market period.
Step 2: Establish the benchmark
Decide how the strategy will be benchmarked beforehand, before interpreting the results.
This decreases the chances of picking up a benchmark just because it offers a good comparison.
Step 3: Record strategy performance
Collect the relevant results, including returns, drawdowns, volatility, number of trades, and other metrics appropriate for the strategy.
Step 4: Include trading costs
Real-world performance can differ significantly from theoretical or backtested results.
Consider costs such as:
- Commissions
- Bid-ask spreads
- Slippage
- Financing costs
- Exchange or platform fees
Ignoring these expenses can make an active strategy appear more attractive than it may be in practice.
Step 5: Compare multiple dimensions
Do not merely ask, "Did the strategy earn more money?"
Think about:
Was it an improvement in terms of return on risk?
This is the key to proper benchmarking.
Step 6: Examine consistency
Analyze the performance for various months, quarters, or periods.
If the strategy is a big earner because of one good period, this strategy may need to be analyzed further than a strategy that performed relatively stable.
Step 7: Investigate significant differences
If the strategy is outperforming or underperforming its benchmark significantly, analyze why.
Determine whether the difference comes from leverage, position sizing, market exposure, or dynamic execution mechanisms such as multi-timeframe algorithms.
Common Benchmarking Mistakes
Avoiding common benchmarking mistakes can make your strategy evaluation more consistent and reliable. Here are the key issues to watch for:
- Choosing an irrelevant benchmark
- Looking only at returns
- Using too little data
- Ignoring trading costs
- Changing the benchmark after testing
- Confusing market performance with strategy performance
How to Interpret Benchmark Results
Benchmarking should be viewed as an analytical process rather than a simple pass-or-fail test.
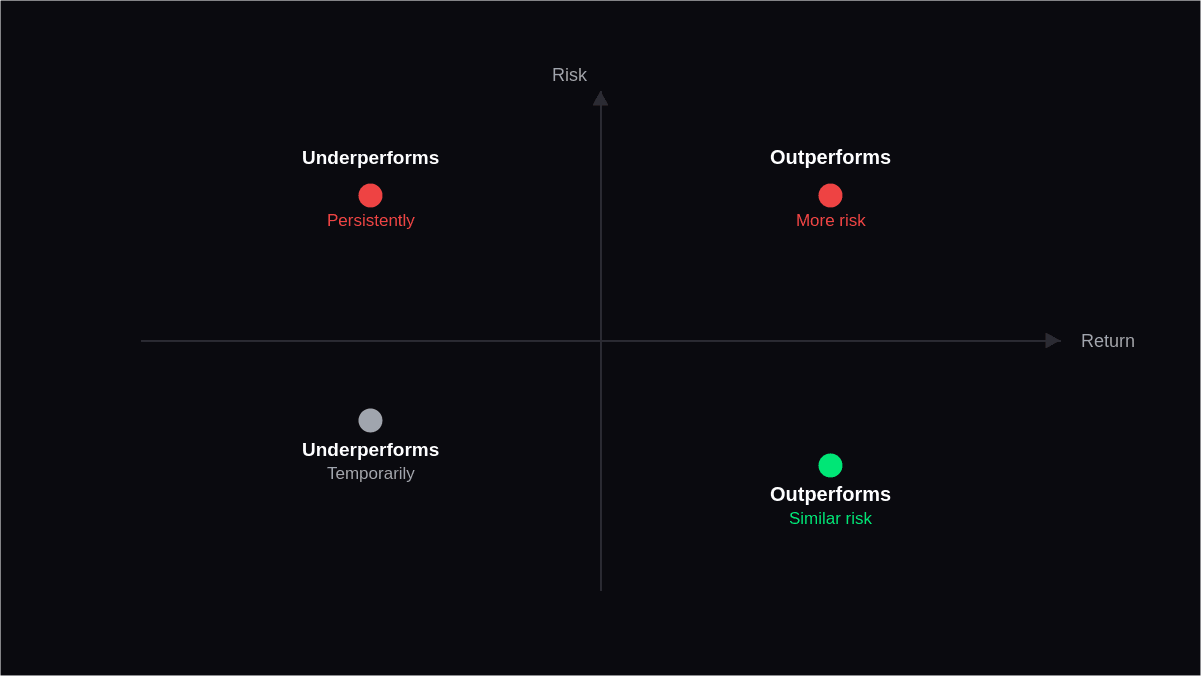
The strategy outperforms with similar risk
This means that the strategy is creating value based on the selected benchmark. Nevertheless, it is important for traders to assess if this outcome holds true through time.
The strategy outperforms but takes much more risk
The gain in returns might not make up for the increased risks. This is where drawdowns, volatility, and risk-adjusted returns come into play.
The strategy underperforms temporarily
Underperformance does not always imply that the trading strategy stopped being effective. Some strategies will perform better in some market conditions compared to others.
The strategy consistently underperforms
Underperformance over relevant time periods warrants further analysis.
Reasons could range from market conditions shifts, difficulties implementing the strategy, costs becoming too high, or weakening of the edge behind the strategy.
When Should You Reassess a Trading Strategy?
One should not use the benchmark to motivate continuous strategy alterations.
Too many alterations will make it difficult to see if the alteration helped the strategy or just allowed it to better fit the historical data.
Rather than that, set specific criteria for the reassessment.
Specifically, reassessment would be justified when:
- Performance changes materially from historical behavior
- Drawdowns exceed previously observed levels
- Trading costs increase significantly
- Market conditions change substantially
- Execution differs from testing assumptions
- The strategy repeatedly deviates from its expected characteristics
The goal of reassessment is to analyze significant changes, not to alter the strategy at every loss.
How to Avoid Overfitting During Benchmarking
The main issue with benchmarking is that traders try to tune their strategy only to beat historical data.
For example, let us imagine that the trader tries to adjust his entry rules, stops, and indicators until he gets a great historical result from his strategy. Such a strategy will work well only in backtesting but fail to perform in reality.
How to minimize the risks:
- Define evaluation criteria in advance.
- Separate development and validation data.
- Test across different market environments.
- Include realistic execution costs.
- Avoid excessive parameter optimization.
- Evaluate whether performance remains stable outside the original sample.
A good strategy cannot be based only on one chosen historical period.
Conclusion
Benchmarks in trading strategies add context where pure profitability alone does not. The analysis of the performance of a trading strategy against a proper benchmark and in the context of returns, risk, costs, consistency, and drawdown will allow traders to get a better picture of the strategy performance.
The best benchmarking procedure is not about coming up with a single number that all the strategies need to beat. It is about making sure that the strategy performs the way it is supposed to perform and that its performance is justified.
A properly selected benchmark can thus be integrated into a proper strategy analysis process instead of just being an additional parameter to optimize.
FAQs
1. What are trading strategy benchmarks?
Benchmarks for trading strategies serve as references in the assessment of the trading strategy's performance. These benchmarks can be market indexes, passive strategies, historical trading strategies' performance, and other suitable benchmarks.
2. What is the best benchmark for a trading strategy?
There is no single best benchmark. It all depends on the market, time horizon, purpose of the trading strategy, risk, and exposure that is being measured.
3. Should I compare a strategy based only on returns?
No. Returns need to be considered along with drawdown, volatility, consistency, transaction costs, and other important performance measures.
4. What does maximum drawdown tell traders?
The maximum drawdown is the greatest peak to trough drawdown observed in the strategy during the assessment period. Maximum drawdown assists the trader in appreciating the magnitude of historical losses.
5. Can a strategy be good even if it does not beat its benchmark?
Yes. The strategy may still have a good use even when it offers something else apart from higher returns, like low drawdown or low volatility.