Volume profile is a type of technical analysis tool that enables traders to analyze the amount of trading activities that have been done at various price levels. Instead of displaying the change in volume from one period to another, it categorizes the volume depending on the price to enable traders to see which areas spent the most or the least amount of time and participation.
Such information could give another dimension to price analysis since traders can be able to analyze the profile and identify areas with high volume and low volume. They can also be able to find the reference levels and how price reacts to those levels.
It is necessary for traders to understand the parts of the profile before applying them in the trading strategy.
What Is Volume Profile?
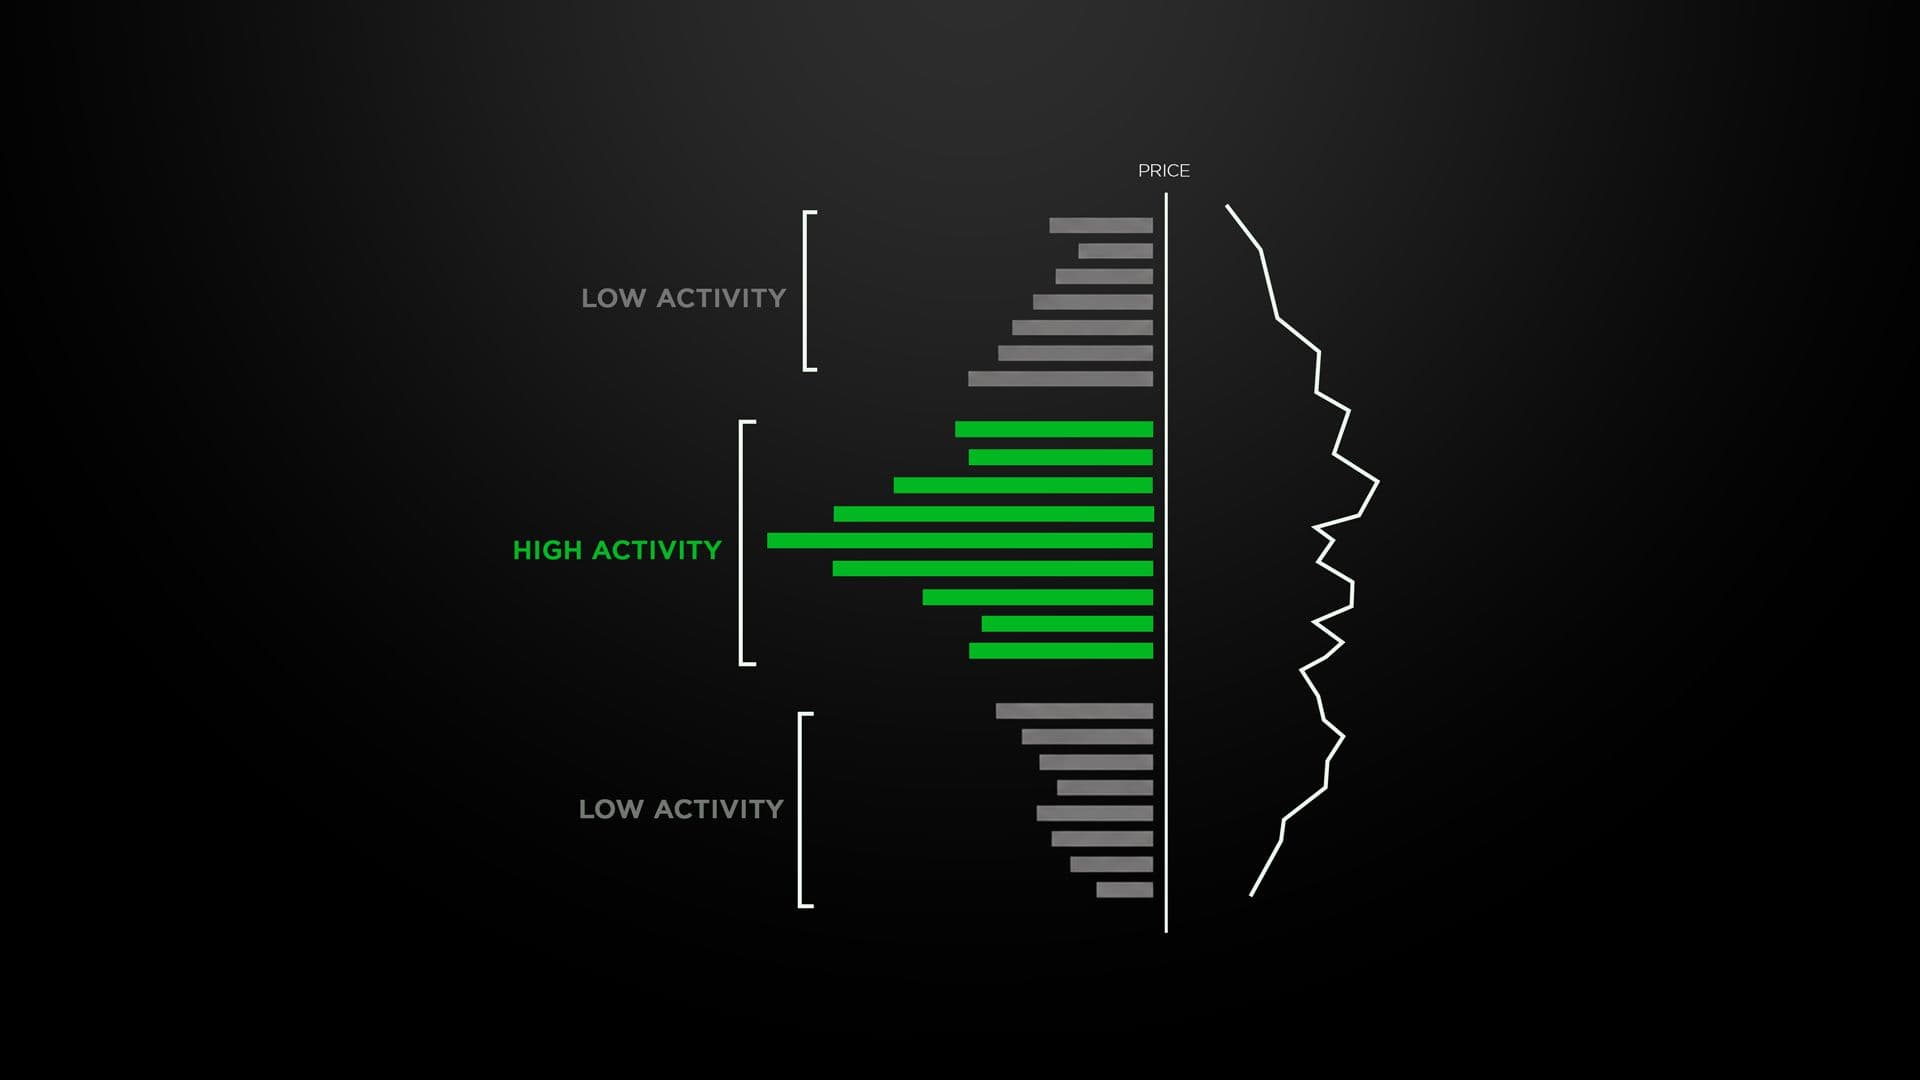
Volume Profile is a chart tool that depicts the volume traded at various price levels during a chosen time period. Typically, its representation is a horizontal histogram appearing near the price graph.
Traditional volume typically gives an answer to the question “How much activity took place during this time?” In contrast, a profile provides insight into the question, “At what prices did this activity take place?”
It is because of this difference that the tool becomes especially important when price-related analysis is required. It allows one to find out whether a lot of trading happened around a particular price level or if the market quickly moved through a zone of relatively low activity.
A profile does not tell us what price will do next. It just provides historical data.
How Volume Profile Is Calculated
The whole process basically consists of subdividing the range of prices into smaller price brackets and allocating the volume of trade to those brackets.
For instance, assume that an investor is using the indicator for a particular trading period. The indicator will analyze the volume of trade in that particular period and distribute it across the prices.
The resulting shape can reveal:
- With high concentrations of trading
- Areas that had low volumes of trade
- The point where volume was highest
- The limits of the value area
- Variations in participation within the chosen range
This will not be the same for various platforms and types of profiles. Certain programs use different calculations when multiple price levels are involved in one candle, thus traders should understand how their specific platform constructs profiles.
Main Components of a Volume Profile
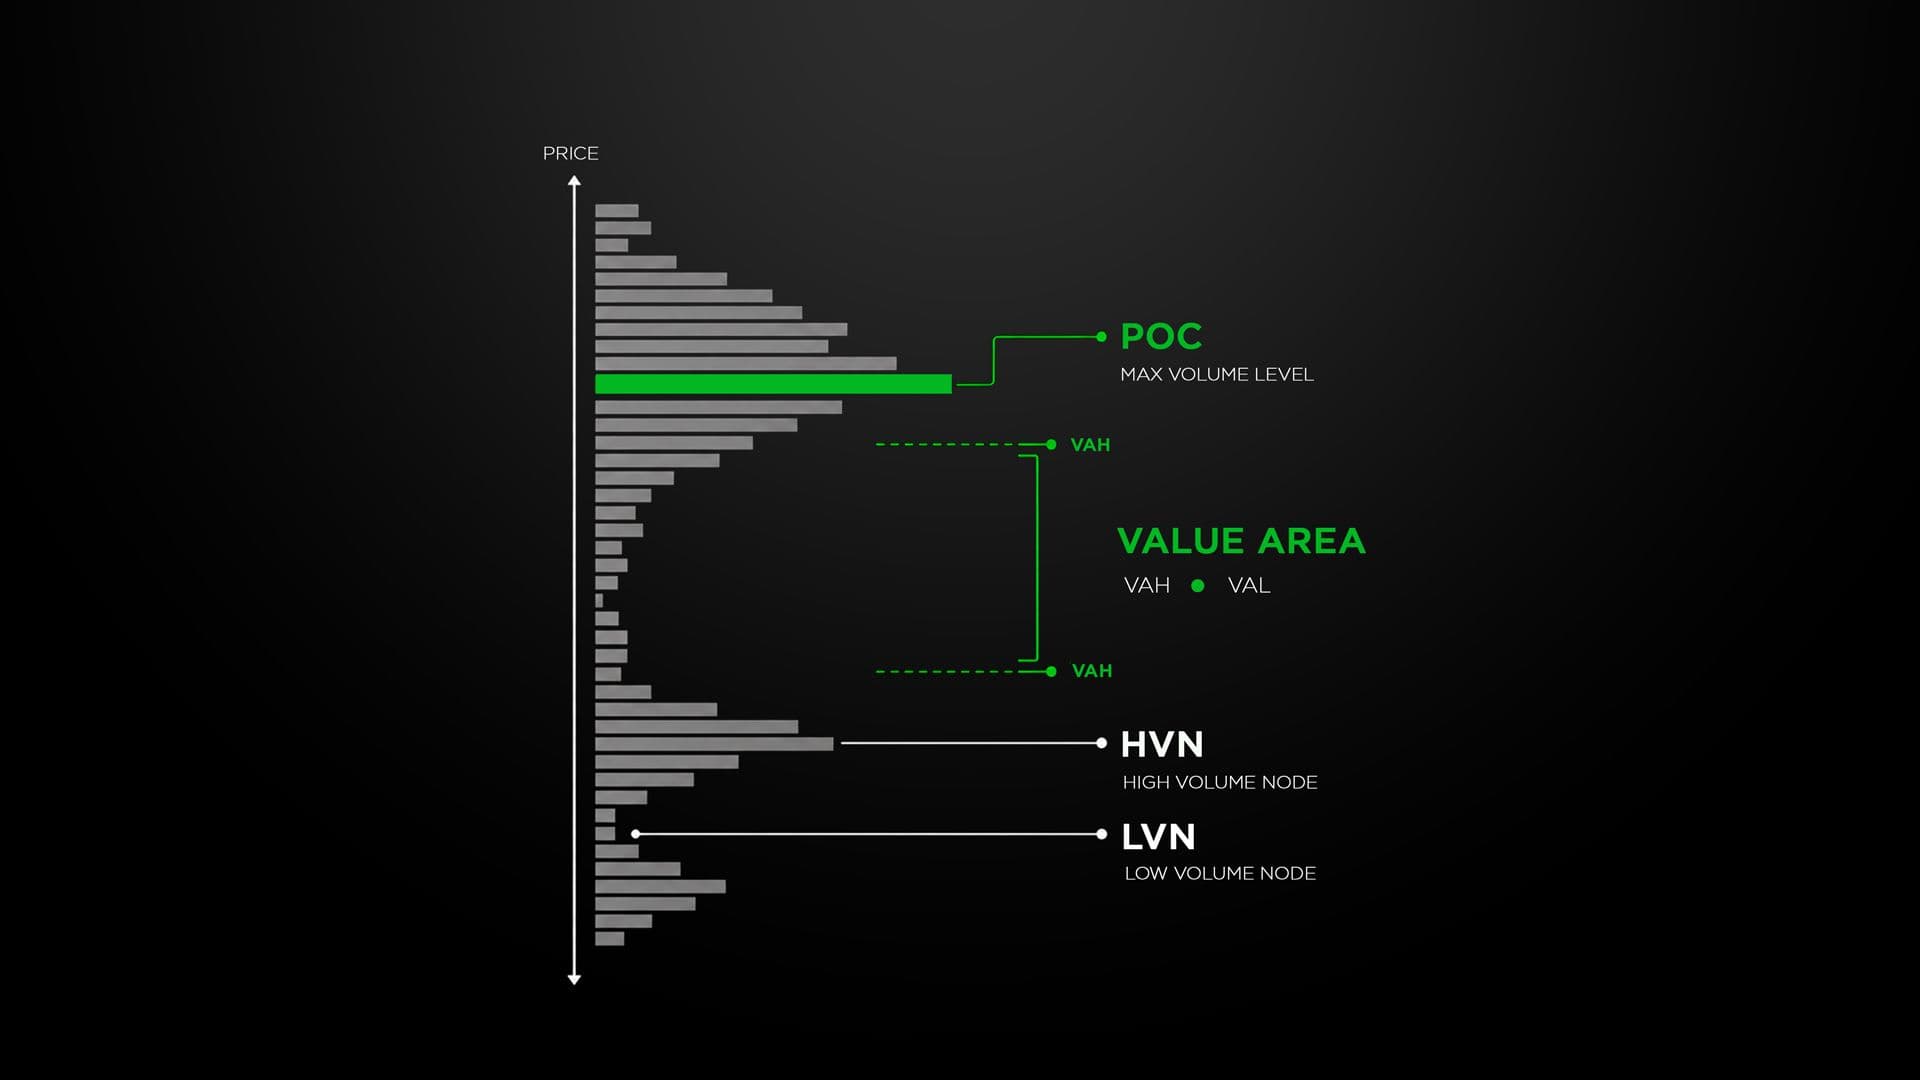
The profile contains several features that traders commonly monitor. Each one describes a different aspect of the market's previous activity.
1: Point of Control
Point of Control, also known as POC, is a price level, which consists of maximum volume within the selected price profile.
This point can serve as an indicator of how high the volume of trade activity at this price was. With the return of prices to the POC, one may see whether the market accepts the price or starts to reject it.
When using point of control trading techniques, one cannot assume that POC will necessarily generate buy/sell signals. It all depends on the market environment and price reaction to the price level.
2: Value Area
The value area is the part of the chart that constitutes a particular percentage of volume. Usually, 70% is used, although other values may be specified.
The area has two important boundaries:
- Value Area High (VAH): The upper boundary
- Value Area Low (VAL): The lower boundary
These levels help traders evaluate whether price is trading within an established area of activity or moving beyond it.
3: High-Volume Nodes
HVN is a high volume node, which refers to locations of trading activity concentration.
HVN can reveal levels where there were many participants during a certain period. The revisit of such a price by the price will allow traders to analyze whether there is activity in the region or whether the market simply moves through it.
The HVN is more likely to be an observed region than a support and resistance one.
4: Low-Volume Nodes
Low-volume Nodes (LVN) represent zones where lower volumes of trade have taken place.
Such zones may emerge in-between other more active zones of participation. In certain market conditions, the price may pass through these zones faster since there is less history of trading in them.
However, a zone of low volumes cannot be considered a signal of breakout or continuation just by itself.
How to Read the Shape of the Profile
The overall shape can provide additional information beyond individual levels.
1: Balanced Distributions
The profile tends to exhibit concentration of trading around a central zone, with a fall-off in participation levels towards the edges of the zones.
Such a configuration would imply that the market took a lot of time setting up a trading range. Traders will monitor the zones looking out for confirmation that price remains within the range or tries to set up a level elsewhere.
2: Multiple High-Volume Areas
The profile might consist of several important activity areas instead of just one primary one.
Several active areas could be related to different stages of acceptance at the selected level. Comparing the areas of activity to the price action could give traders an idea about changes in the participation.
3: Thin Areas Between Distributions
A small segment in between larger volume segments is an indication that not much trading was done in those prices.
If price enters such a zone, one can be able to see if the price moves fast to another zone or starts creating a new action zone in that thin segment.
This profile is best read in conjunction with the price chart.
How Traders Use Volume Profile in Market Analysis
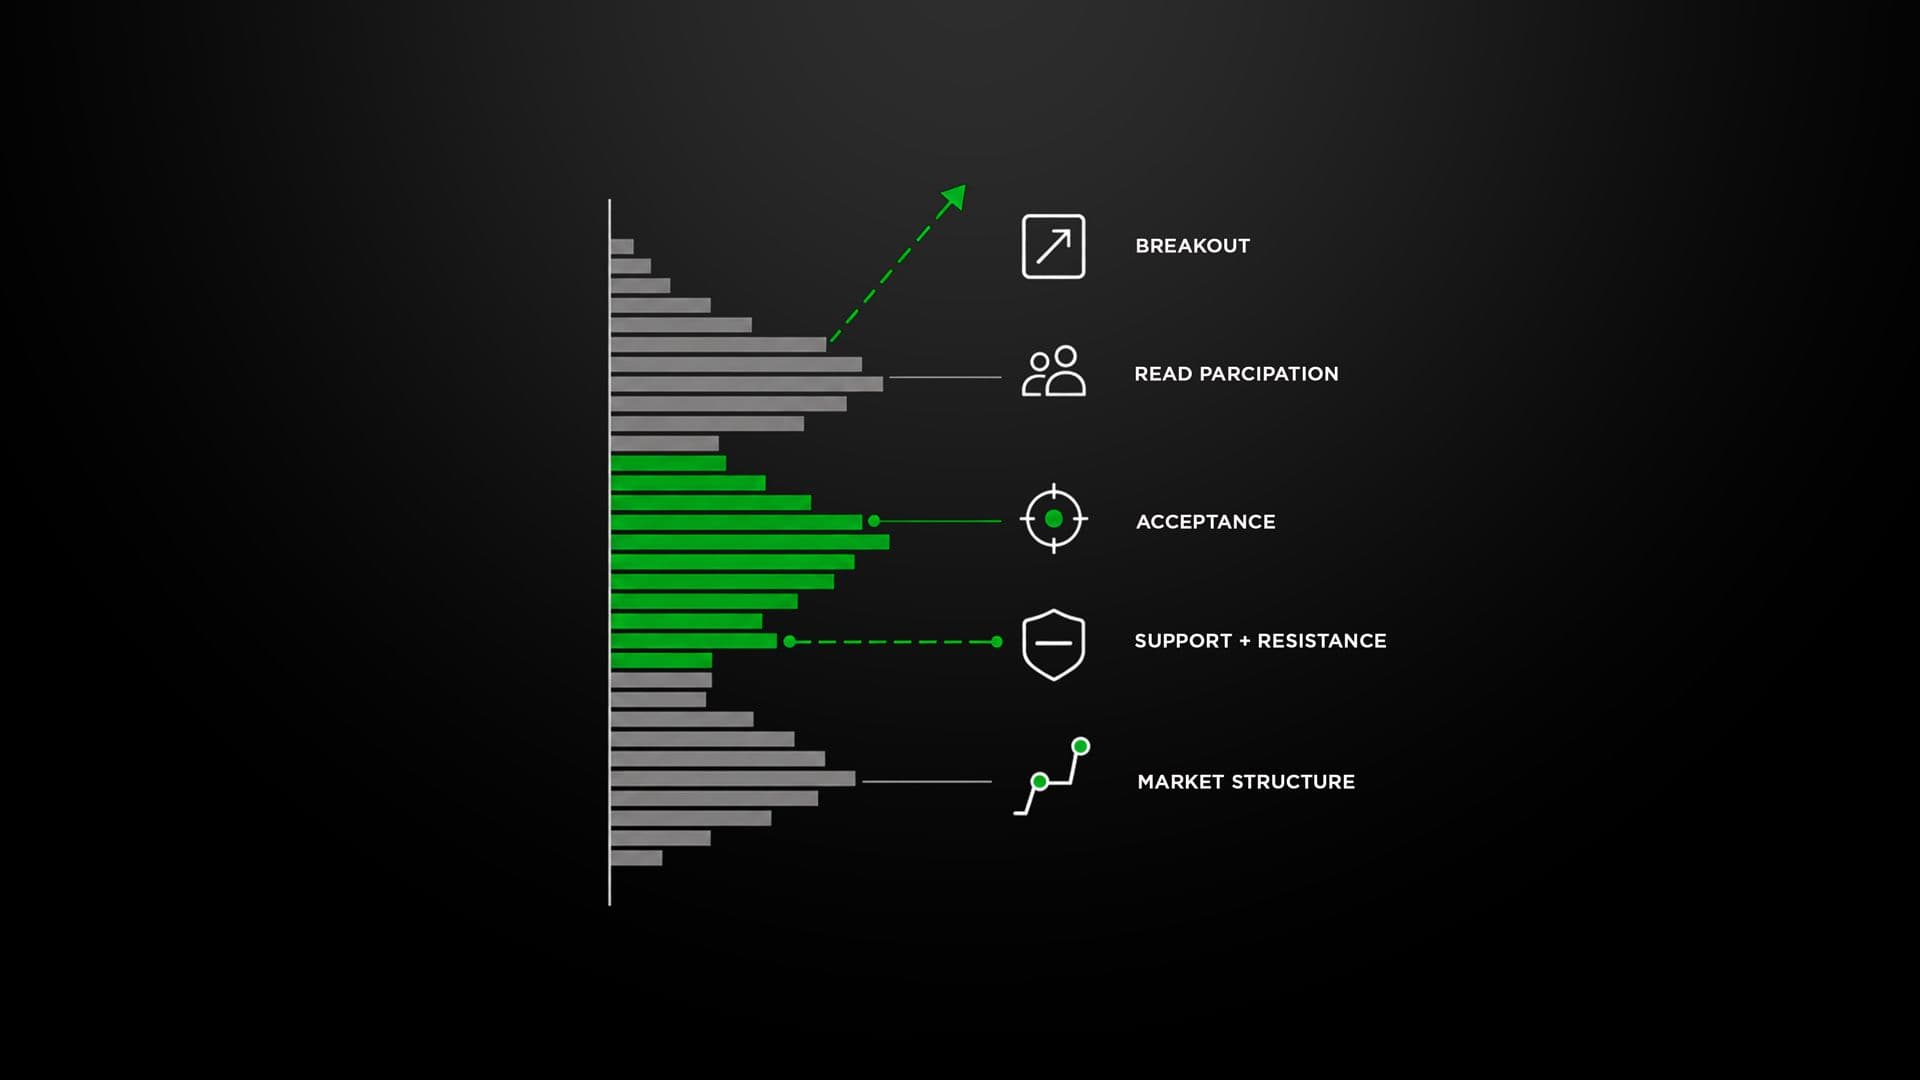
There are several practical ways traders can incorporate volume profile indicators into their analysis.
Identifying Areas of Acceptance
A high volume zone can indicate where the market has been very active before.
When price returns to that zone, traders may analyze if the same level of participation is witnessed once again. Increased participation in the area may signify acceptance, while a strong rejection may have another meaning.
Assessing Breakouts
The breakout will become more meaningful in the context of observing where the breakout takes place in terms of its profile.
For instance, a breakout of a price above a well-defined value zone might serve as a sign for traders to check whether or not there is a formation of activity at a new price level or whether the price returns to the previous range.
Combining It With Support and Resistance
The profile levels can serve as an aid to classical support and resistance analysis.
When the support level recognized before corresponds to a high volume level, then such an intersection can provide traders with more information. However, when there is no high volume at the particular price level, other analysis techniques may be applied.
These two approaches are not mutually substitutable. The traditional analysis is based mainly on the previous reaction of prices, whereas the profile provides data on the distribution of volume.
Studying Market Structure
Another application of the profile would be its utilization in conjunction with highs and lows, breakout patterns, and range patterns.
For example, one might consider whether a developing trend is producing areas of participation at higher and higher, or lower and lower prices. Volume concentration changes may offer additional information about structural change.
Volume Profile vs. Traditional Volume
Although both tools measure trading activity, they present the information differently.
| Feature | Volume Profile | Traditional Volume |
|---|---|---|
| Main measurement | Volume by price | Volume by time |
| Chart orientation | Horizontal | Vertical |
| Primary question | Where did activity occur? | When did activity occur? |
| Key Metrics | POC, VAH, VAL, HVNs, LVNs | Volume spikes and averages |
| Useful for | Price-level analysis | Session and momentum analysis |
| Typical placement | Along the price scale | Below the price chart |
Using both can provide a broader picture. Traditional volume can show when participation increased, while the profile can show where that participation was concentrated.
Volume Profile vs. Market Profile
Volume profile and market profile are sometimes confused because both organize information around price. Their underlying measurements, however, are different.
| Aspect | Volume Profile | Market Profile |
|---|---|---|
| Primary measurement | Traded volume | Time spent at price |
| Common representation | Horizontal volume histogram | TPOs (Time Price Opportunities) |
| Main focus | Where trading activity was concentrated | Where the market spent the most time |
| Key question | How much volume traded at this price? | How long did the price remain at this level? |
| Useful for | Identifying high- and low-volume areas | Studying market acceptance and distribution |
| Data emphasis | Volume participation | Time and price interaction |
The volume profile is concerned with the volume traded at certain price levels. Market Profile, however, is associated with the time spent at a certain price level and is depicted using such terms as TPOs.
It is important to note that the price level may have significant volumes traded in spite of not having spent much time there. Therefore, one needs to know what information their tool provides.
A Practical Workflow for Using the Tool
A structured process can make profile analysis easier to apply consistently.
1. Define the Market Context
Begin with analyzing the larger picture. Try to establish if there is an upward trend, a sideways pattern, consolidation, or volatility in the market.
The same profile will act differently in different conditions.
2. Select the Appropriate Range
Choose a range of profiles that fits the trade set-up.
This can be one bar, the latest swing, a consolidation area, or any other significant range on the chart. It is important not to choose random ranges just because they create attractive levels.
3. Mark the Important Areas
POC identification, boundary definition of the value zone, as well as high and low volume zones should be performed.
Not all fluctuations require marking; attention should be paid only to those that are relevant to the existing price environment.
4. Observe Price Interaction
When price gets to a critical profile level, wait for a confirmation of what the market is really doing.
A confirmation might be rejection, consolidation, acceptance, or continuation of the level.
5. Confirm the Trading Idea
Use additional evidence before making a decision. Depending on the strategy, this may include trend direction, market structure, momentum, candlestick behavior, or another technical tool.
6. Define Risk Before Entry
The profile will assist in making the analysis but should not be used in lieu of risk management.
Find out at which point the profile becomes invalid and use the position size based on the level of risk involved. The profile looks good; however, this does not guarantee a profitable trade.
What Is Value Area Trading?
In value area trading, attention should be paid to the behavior of the price level in relation to the upper and lower limits of the defined value zone.
A trader can observe whether the price stays inside the zone, rejects it, or leaves it and starts creating the activity at new price levels.
It is essential to consider the response itself, but not just the place. Price movement over the Value Area High, for instance, does not necessarily indicate further increase. It should be determined if the market accepts new price levels or returns to the predefined one.
Common Mistakes to Avoid
Using the profile effectively requires avoiding several common errors:
- Treating the POC as an automatic entry signal
- Assuming every HVN will become strong support or resistance
- Interpreting an LVN as a guaranteed continuation zone
- Applying profiles to arbitrary chart ranges
- Ignoring the difference between historical activity and current conditions
- Using too many profile levels at once
- Entering immediately when price touches a marked area
- Forgetting to account for volatility and risk
- Treating the indicator as a standalone prediction tool
The goal is not to collect as many levels as possible. It is to identify the areas that genuinely contribute to the trading thesis.
Final Takeaway
The volume profile offers another perspective on market behavior, as it tells us how participation was distributed throughout the price levels. The POC, value area, high-volume nodes, and low-volume nodes in the profile could provide clues on where the market has established its acceptance in the past and where there has been little activity.
The utility of this indicator increases even more when it is used in conjunction with price behavior, trending analysis, and good risk management practices. Instead of making predictions based on the profile level, the trader can treat the profile as a platform on which he or she observes the price movement.
When used properly, this indicator will add valuable insights into technical analysis without becoming the only source of information for trade decisions.