Understanding why a trading strategy performs differently from the broader market requires more than simply looking at its total return. Two concepts that can add useful context are alpha and beta.
Alpha vs Beta in Trading helps explain the difference between performance that goes beyond a benchmark and returns that are influenced by broader market movements.
For traders, these measures can provide a more complete view of strategy performance. Alpha focuses on the return generated beyond what would be expected from benchmark exposure, while beta shows how closely a strategy or asset tends to move with that benchmark.
Together, they can provide useful context when using Trading Strategy Benchmarks to evaluate performance.
In this blog, we will cover what alpha and beta mean in trading, how they differ and how traders can use both measures to evaluate the performance and market exposure of a trading strategy.
What Is Alpha in Trading?
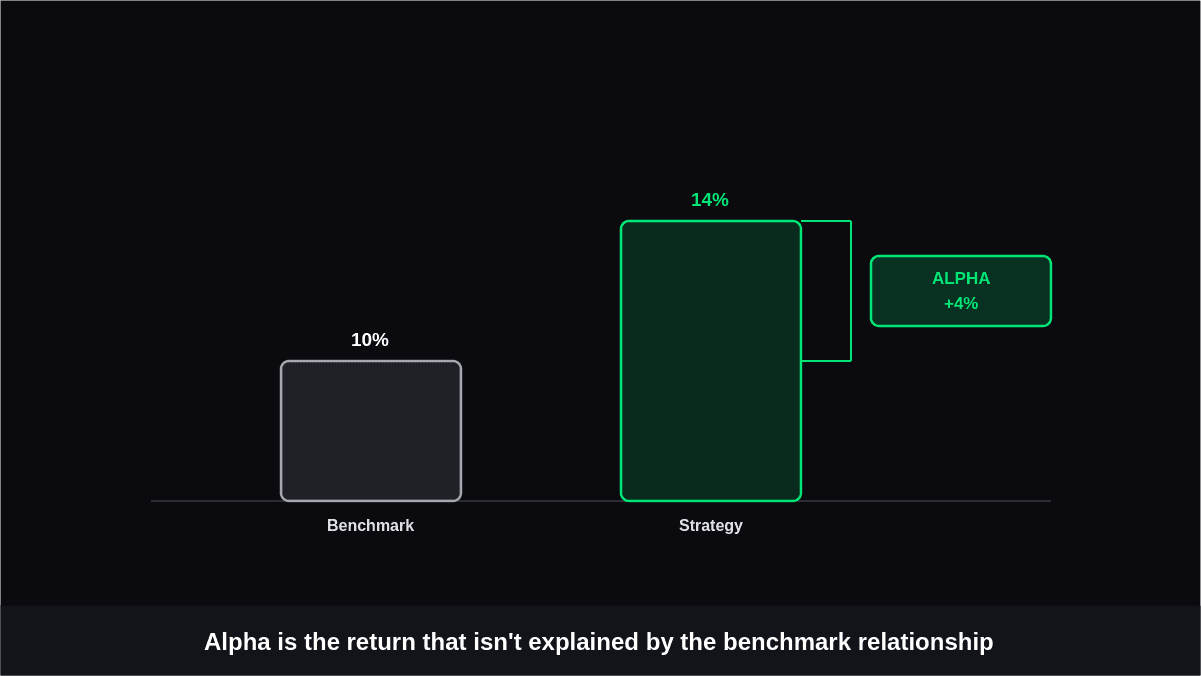
Alpha in trading measures the excess return generated by an investment or strategy relative to a chosen benchmark, after accounting for the expected return associated with its market exposure.
For example, suppose a strategy returns 14% during a period when its benchmark returns 10%, with its level of market exposure taken into account.
The portion of performance that cannot be explained by that benchmark relationship contributes to its alpha.
A positive alpha suggests that a strategy produced more return than its benchmark-based expectation. Negative alpha indicates that it underperformed that expectation.
Alpha is therefore useful when the goal is to determine whether a strategy is adding value rather than simply benefiting from a rising market.
What Does Beta Measure?
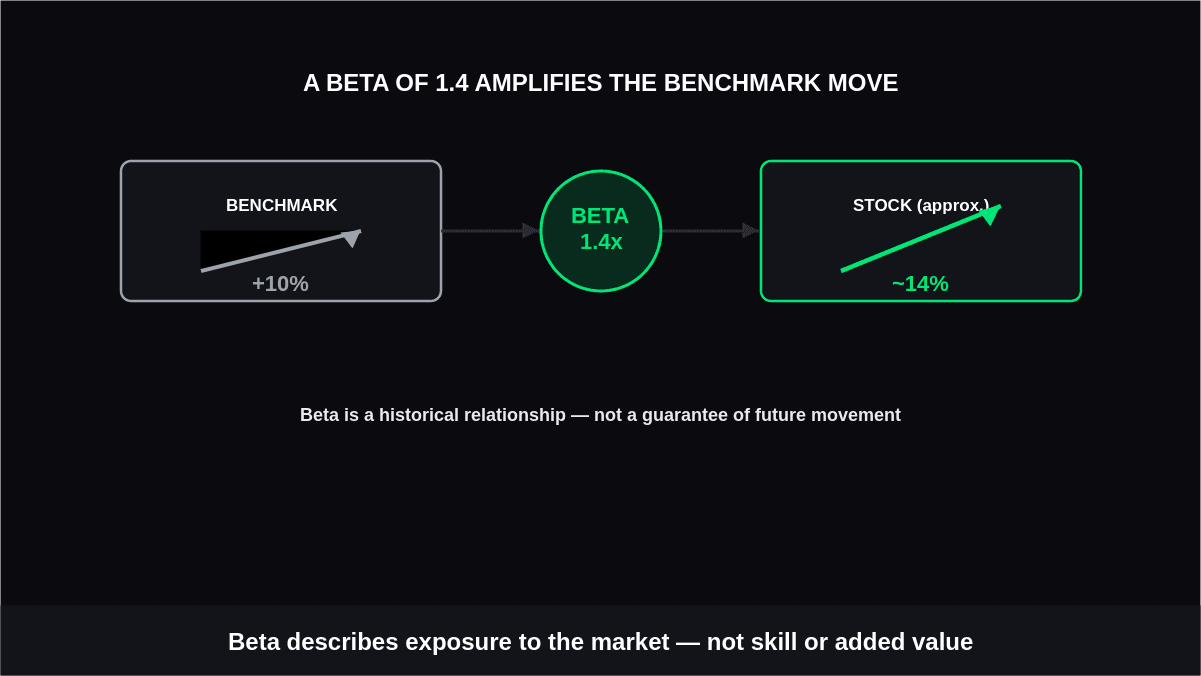
Beta in trading describes how sensitive an asset or strategy is to movements in a benchmark.
A beta of 1 generally means the strategy has historically moved in line with the benchmark. A beta above 1 indicates greater sensitivity, while a beta below 1 indicates lower sensitivity.
Consider a stock with a beta of 1.4. If the benchmark rises by 10%, a simplified interpretation would suggest that the stock could move about 14% in the same direction. However, beta is based on historical relationships, so actual returns can differ considerably.
Unlike alpha, beta does not tell you whether a strategy is generating superior performance. It primarily describes its exposure to systematic market movements.
Alpha vs Beta in Trading
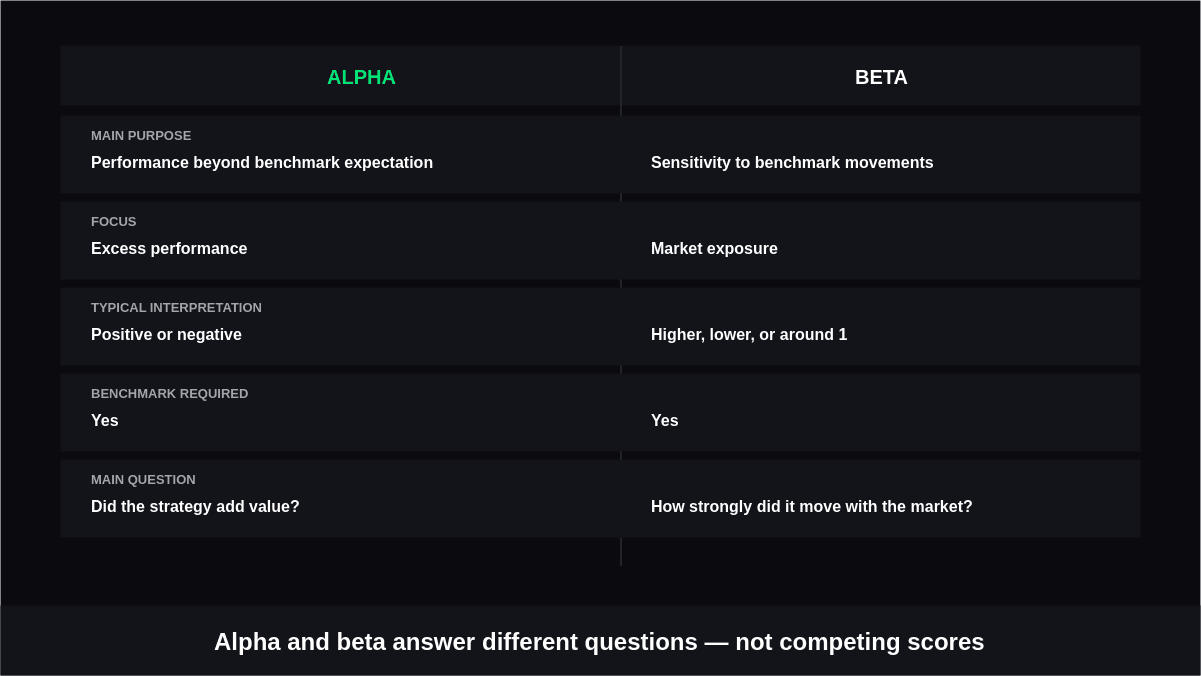
Alpha and beta answer different questions, so treating them as competing measurements can lead to confusion.
| Factor | Alpha | Beta |
|---|---|---|
| Main purpose | Measures performance beyond a benchmark expectation | Measures sensitivity to benchmark movements |
| Focus | Excess performance | Market exposure |
| Typical interpretation | Positive or negative | Higher, lower, or around 1 |
| Benchmark required | Yes | Yes |
| Useful for | Evaluating strategy performance | Understanding systematic risk |
| Main question | Did the strategy add value? | How strongly the market move? |
A strategy can have high beta without producing positive alpha. For instance, it may generate large gains during a bull market simply because it carries substantial market exposure. That does not automatically mean the strategy produced superior risk-adjusted performance.
How Alpha and Beta Work Together
Looking at only one measurement can leave an incomplete picture.
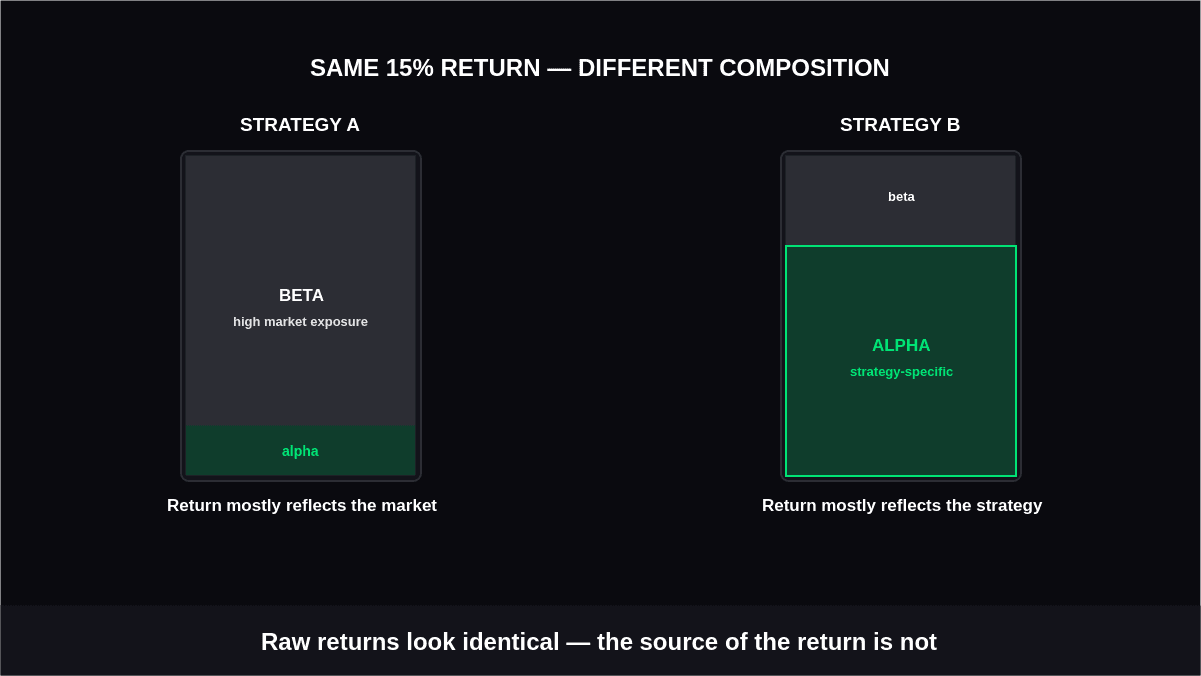
- Strategy A: Has relatively high market exposure, so its 15% return may be influenced heavily by benchmark movements.
- Strategy B: Has lower market exposure, so its 15% return may reflect more strategy-specific performance.
Imagine two strategies that both generate a 15% return. Strategy A has relatively high market exposure, while Strategy B has lower exposure. If the benchmark also performed strongly during that period, Strategy A's return may largely reflect its beta.
Strategy B could potentially demonstrate stronger alpha if it achieved its return without relying as heavily on benchmark movements.
- Raw returns: Show how much a strategy gained but not necessarily where that performance came from.
- Alpha: Helps assess performance beyond what can be attributed to market exposure.
- Beta: Helps indicate how strongly returns are associated with benchmark or market movements.
This distinction matters because raw returns do not reveal where performance came from. Combining alpha and beta analysis gives traders a clearer view of whether results were driven by market direction, strategy-specific decisions, or both.
Why Benchmark Selection Matters
Alpha and beta are meaningful only in relation to an appropriate benchmark. A U.S. large-cap equity strategy might reasonably be compared with a broad large-cap stock index, while a bond strategy would require a different reference point. Comparing a strategy with an unrelated benchmark can produce misleading conclusions. The time period also matters.
A strategy's beta may change across different market environments, while measured alpha can vary depending on the benchmark, timeframe, and methodology used.
At last results through in-sample vs out-of-sample testing can help traders see whether these performance characteristics remain consistent across different periods. Traders should therefore avoid treating either number as a permanent characteristic.
Using Alpha and Beta to Evaluate Trading Strategies
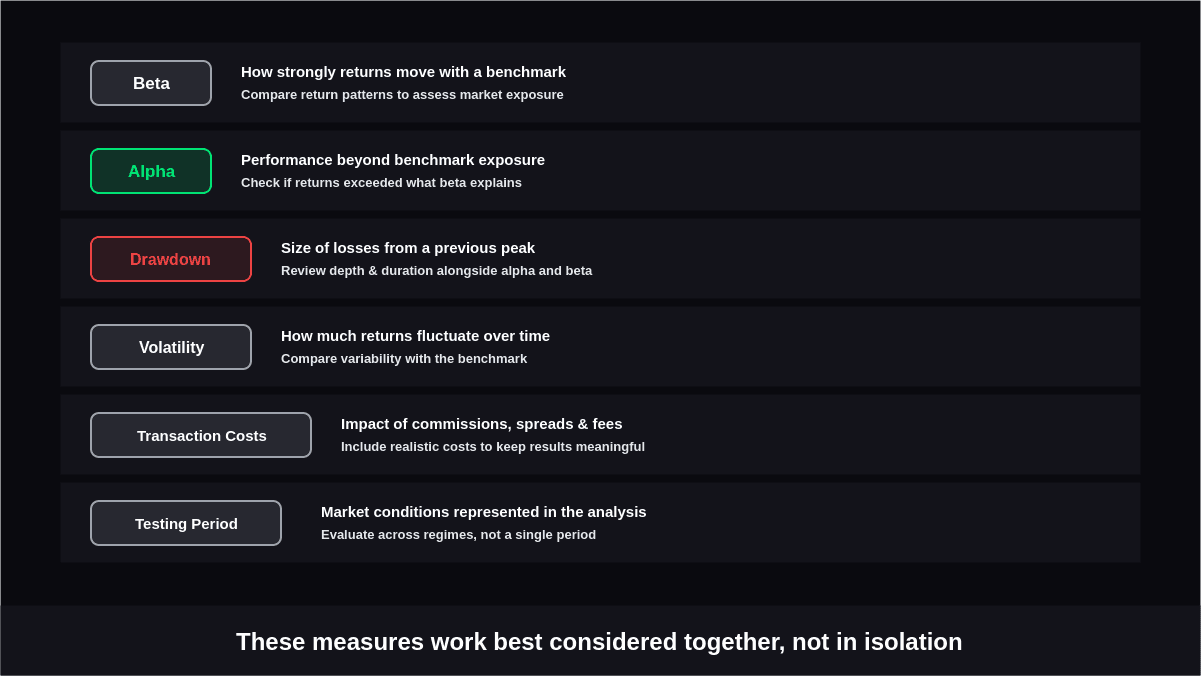
Alpha and beta can provide a clearer way to understand where a trading strategy's historical returns may have come from. Looking at both measures together helps separate performance linked to market movements from performance that may be independent of those movements.
| Measurement | What It Shows | How to Evaluate It |
|---|---|---|
| Beta | How strongly a strategy's returns move with a benchmark | Compare the strategy's return patterns with the benchmark to assess its market exposure |
| Alpha | Performance beyond what would be expected from the strategy's benchmark exposure | Examine whether returns exceeded the level reasonably explained by beta and benchmark performance |
| Drawdown | The size of losses from a previous peak | Review the depth and duration of losses alongside alpha and beta |
| Volatility | How much strategy returns fluctuate over time | Compare return variability with the benchmark and the strategy's overall risk profile |
| Transaction Costs | The impact of commissions, spreads, and other trading expenses | Include realistic costs to determine whether historical performance remains meaningful |
| Testing Period | The market conditions represented in the analysis | Evaluate results across different market regimes rather than relying on a single period |
These measures should be considered together rather than in isolation. A strategy may show positive alpha while also carrying high volatility or significant drawdowns, and its historical relationship with a benchmark may change as market conditions shift.
What Alpha and Beta Cannot Tell You
Neither metric should be treated as a complete measure of strategy quality.
Alpha does not guarantee that excess performance will continue. Historical alpha can disappear when market conditions change or when the underlying strategy loses its effectiveness.
Beta also does not capture every form of risk. It focuses on sensitivity to a particular benchmark and does not fully describe liquidity risk, concentration risk, execution problems, or sudden market events.
For a more complete assessment, traders can combine these measures with volatility, drawdown, win rate, and risk adjusted returns.
Practical Example
Suppose a trading strategy returns 12% over a year while its benchmark returns 8%.
If the strategy has a beta close to 1, its performance broadly reflects the market's direction, but the additional return may indicate positive alpha depending on the calculation method.
Now consider another strategy that also earns 12% but has a beta of 1.5. Its higher market sensitivity means a greater portion of its result may be associated with taking more systematic exposure.
The two strategies therefore produced the same headline return but may have achieved it through very different risk profiles.
Conclusion
Alpha vs Beta in Trading becomes easier to understand when the two measures are viewed as answers to separate questions. Alpha examines performance beyond what benchmark exposure would explain, while beta shows how strongly a strategy tends to respond to market movements.
Neither measure should be used alone. Traders can use benchmark selection, historical returns, drawdowns, volatility, and risk adjusted returns alongside alpha and beta to build a more complete picture of strategy behavior.
These factors can also be included when evaluating backtesting metrics to understand how a strategy performed across different conditions. The goal is not simply to identify a higher number, but to understand what actually contributed to the observed performance.