Trading Blog

Insights, strategies, and guides to help you trade smarter.

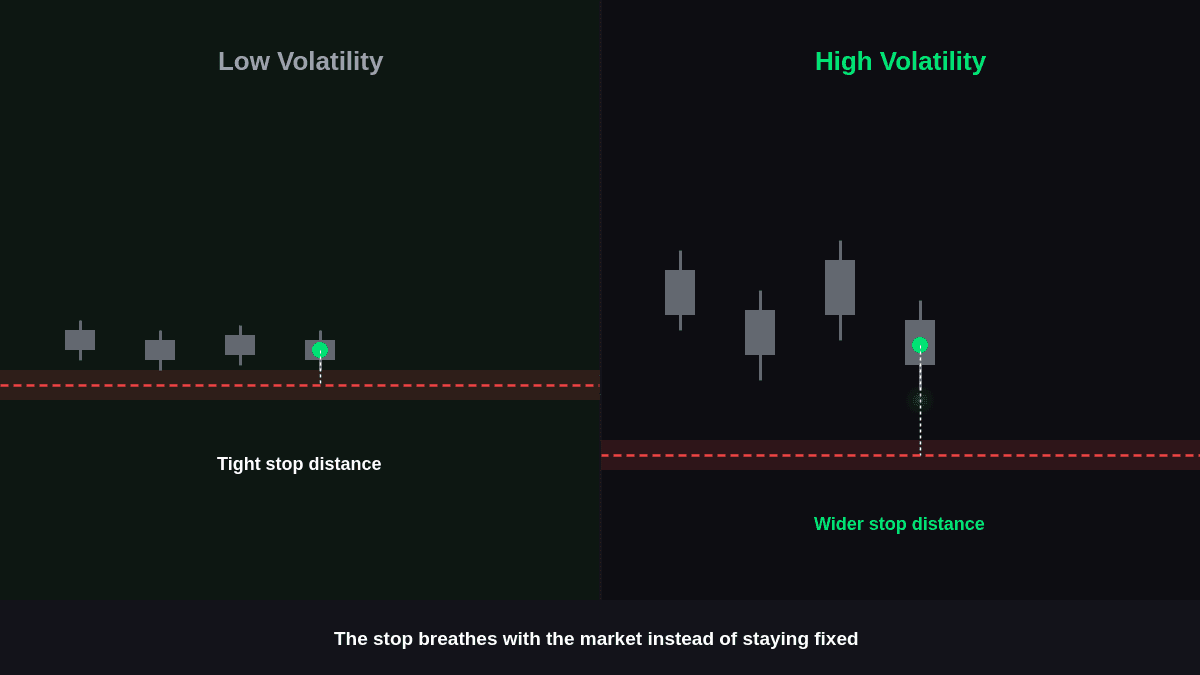
ATR Indicator for Stop Loss and Smarter Risk Management
Trading

ATR Indicator for Stop Loss and Smarter Risk Management

Setting a stop loss too close to an entry can expose a trade to normal market fluctuations, while placing it too far away can create unnecessary risk. The ATR indicator for stop loss offers a practical way to account for changing volatility when deciding how much room a trade needs.

August 30, 2026
Read more
Stochastic Oscillator vs RSI: Which Momentum Indicator Fits Your Style?
Trading

Stochastic Oscillator vs RSI: Which Momentum Indicator Fits Your Style?

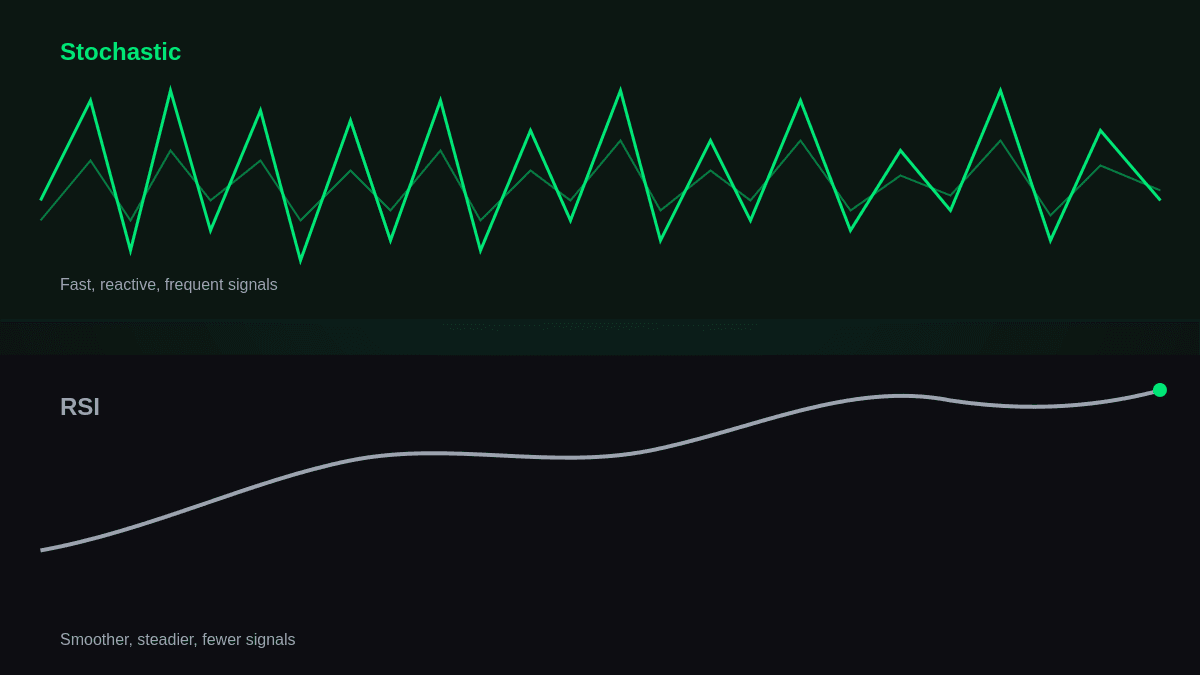
Choosing between momentum indicators can be difficult when two tools appear to provide similar signals. The Stochastic oscillator vs RSI comparison becomes especially useful because both can identify momentum shifts and potentially highlight overbought or oversold conditions, yet they measure price behavior differently.

August 30, 2026
Read more
Ichimoku Cloud Strategy: A Complete Guide for Beginners
Trading

Ichimoku Cloud Strategy: A Complete Guide for Beginners

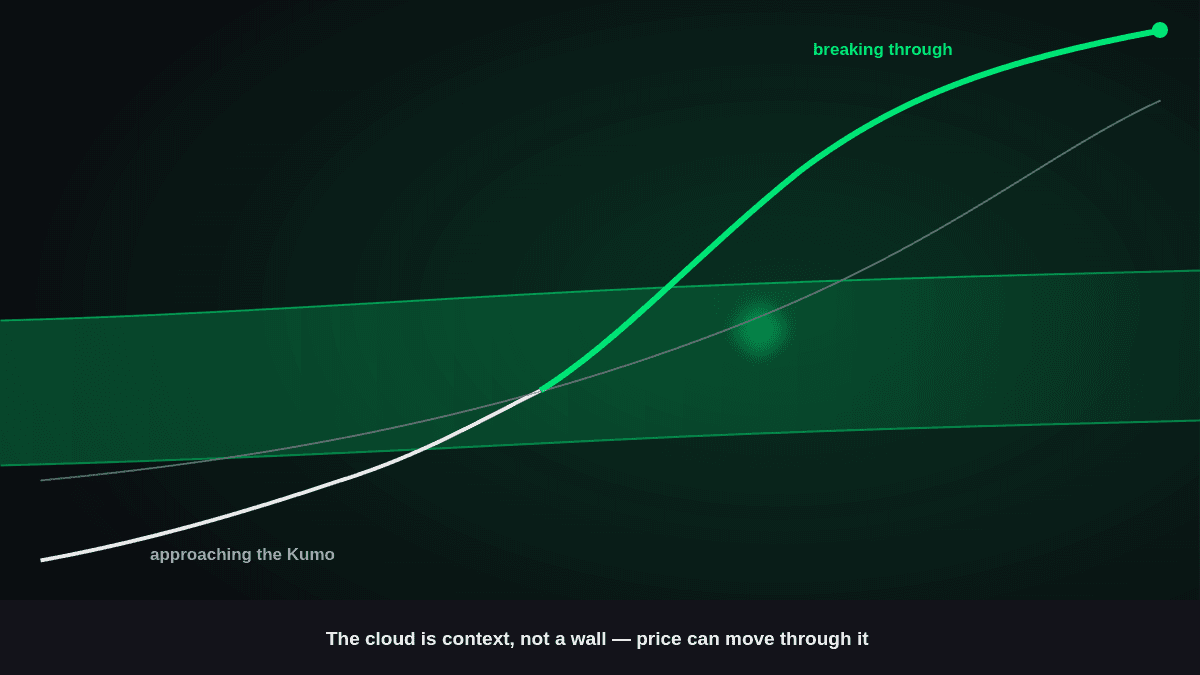
The Ichimoku Cloud strategy gives traders a way to assess trend direction, momentum, support, resistance, and potential trade setups from one chart. Although the indicator can look complicated at first, its five components each have a specific role.

August 30, 2026
Read more
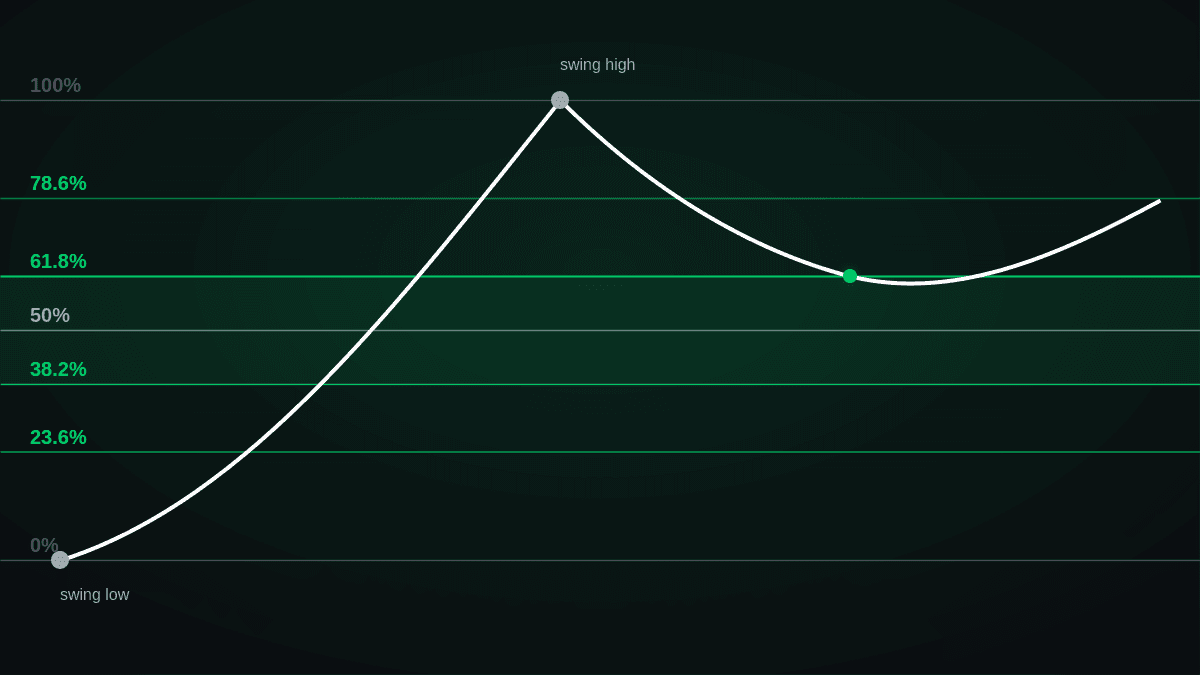
Fibonacci Retracement Levels: A Complete Guide
Trading

Fibonacci Retracement Levels: A Complete Guide

Fibonacci Retracement Levels: A Complete Guide

August 29, 2026
Read more
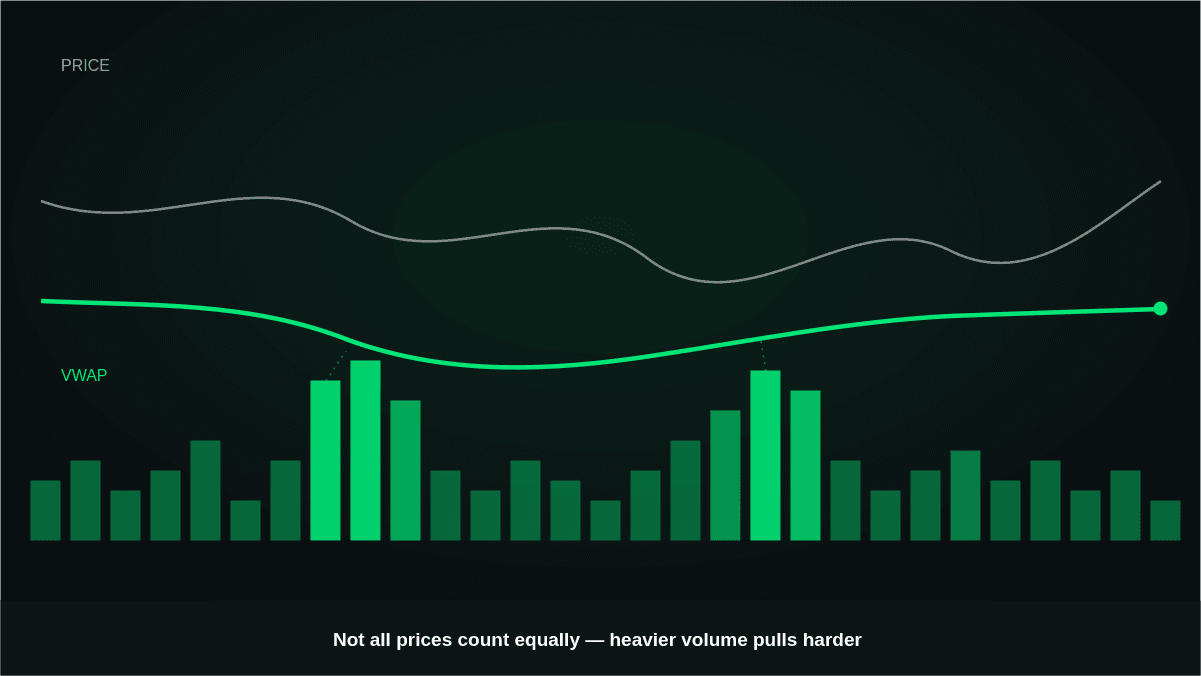
VWAP Trading Strategy: Using VWAP for Entries and Confirmation
Trading

VWAP Trading Strategy: Using VWAP for Entries and Confirmation

The VWAP trading strategy gives day traders a way to judge where price is trading relative to the

August 29, 2026
Read more
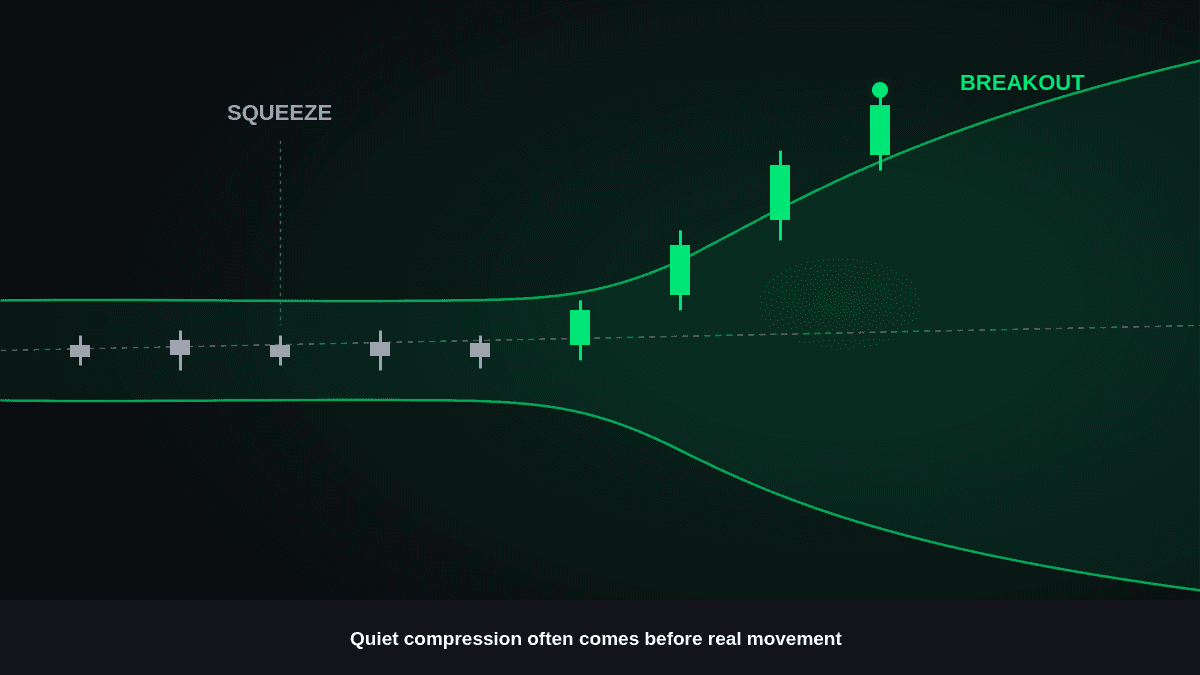
Bollinger Bands Strategy: Trading Squeezes and Breakouts
Trading

Bollinger Bands Strategy: Trading Squeezes and Breakouts

A Bollinger Bands strategy can help traders understand how price is behaving relative to its recent volatility. Rather than treating the upper or lower band as an automatic buy or sell signal, traders can use the bands to identify periods of contraction, expansion, continuation, and possible exhaustion.

August 28, 2026
Read more