Trading Blog

Insights, strategies, and guides to help you trade smarter.

Heikin-Ashi vs Candlestick Charts: Which Should You Use?
Trading

Heikin-Ashi vs Candlestick Charts: Which Should You Use?

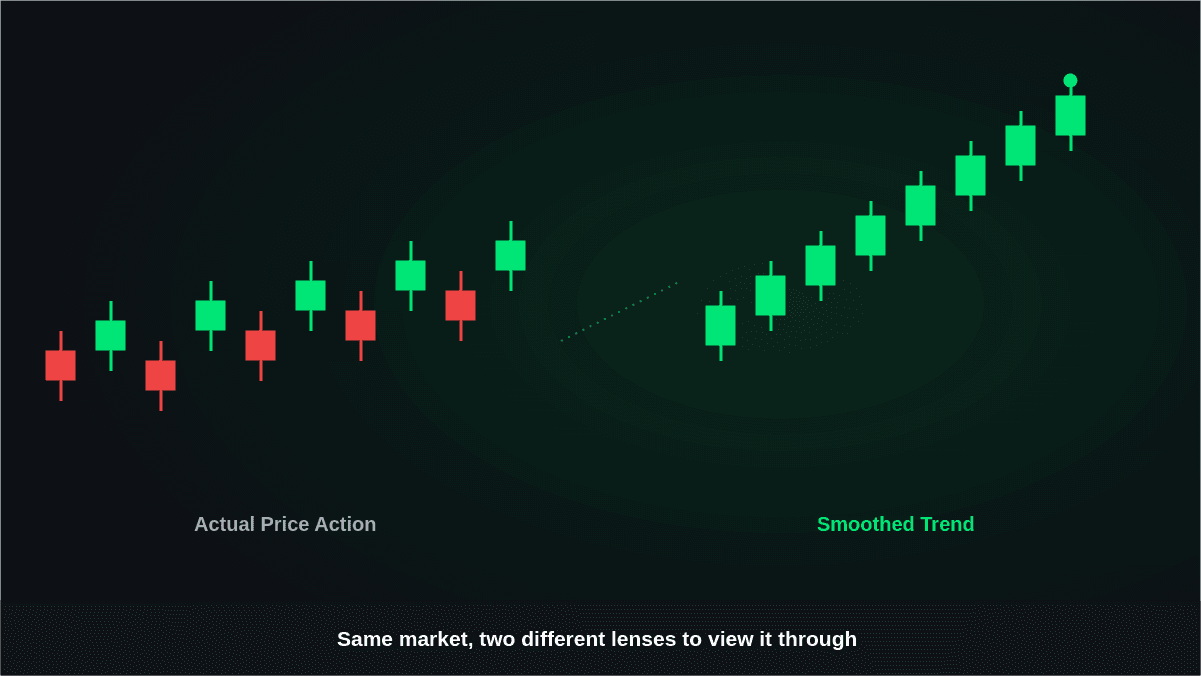
Choosing between different chart types can change how easily you interpret market movement. Heikin-Ashi vs candlestick charts is an important comparison because both display price action differently and can lead traders to focus on different aspects of the market. Traditional candlesticks show the actual open, high, low, and close for each period, while Heikin-Ashi modifies price data to create a smoother visual representation.

September 1, 2026
Read more
Renko Charts Explained: Filtering Noise From Price Action
Trading

Renko Charts Explained: Filtering Noise From Price Action

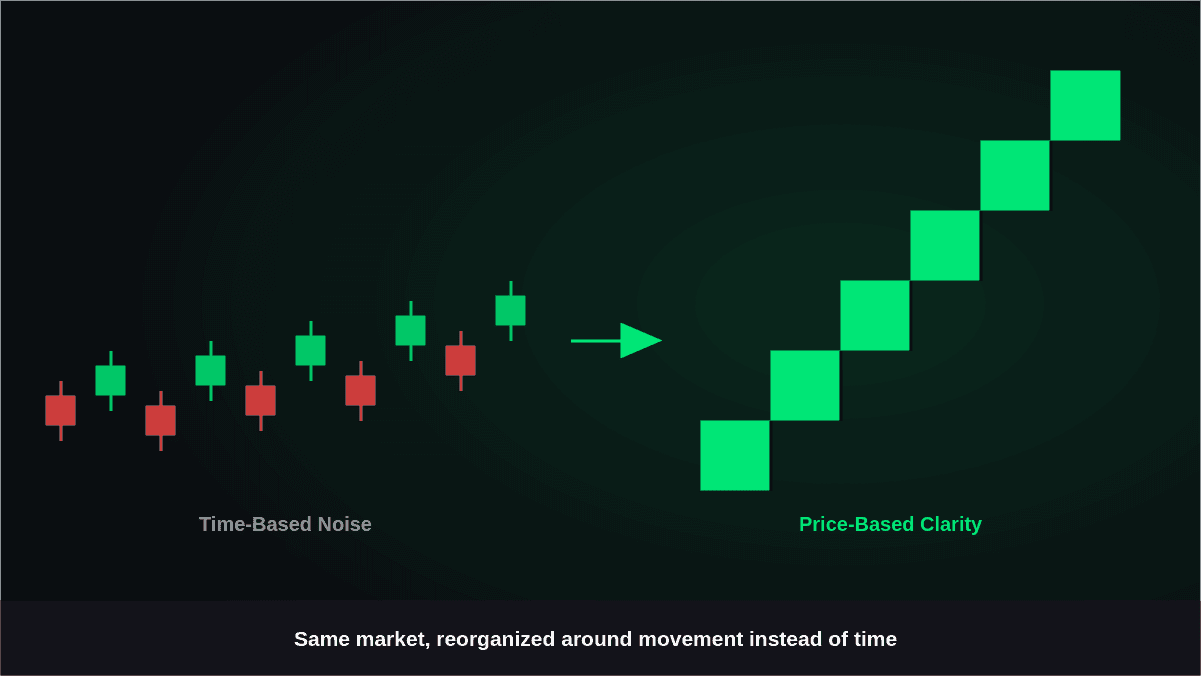
Renko charts explained in simple terms like take it as a useful starting point for traders who want to understand price movement without getting distracted by every small fluctuation. Unlike conventional time-based charts, Renko charts organize market movement around predefined price changes rather than fixed periods.

September 1, 2026
Read more
Ascending and Descending Triangle Pattern Guide
Trading

Ascending and Descending Triangle Pattern Guide

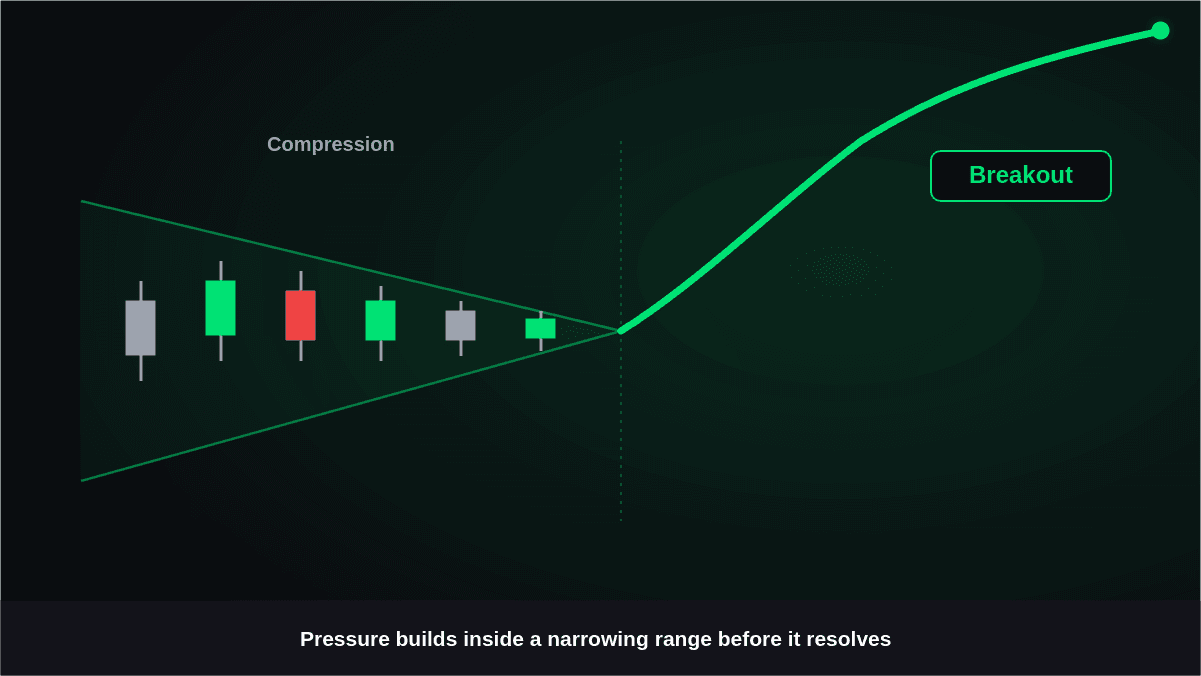
The ascending and descending triangle pattern can help traders recognize periods when price is compressing before making a potentially significant move. These formations are built from converging trendlines, but their structure and market implications are not identical. An ascending triangle generally develops as buyers repeatedly defend higher lows against a relatively stable resistance area, while a descending triangle often shows sellers pressing against consistent support.

September 1, 2026
Read more
What Is a Doji Candlestick? Types and What They Signal
Trading

What Is a Doji Candlestick? Types and What They Signal

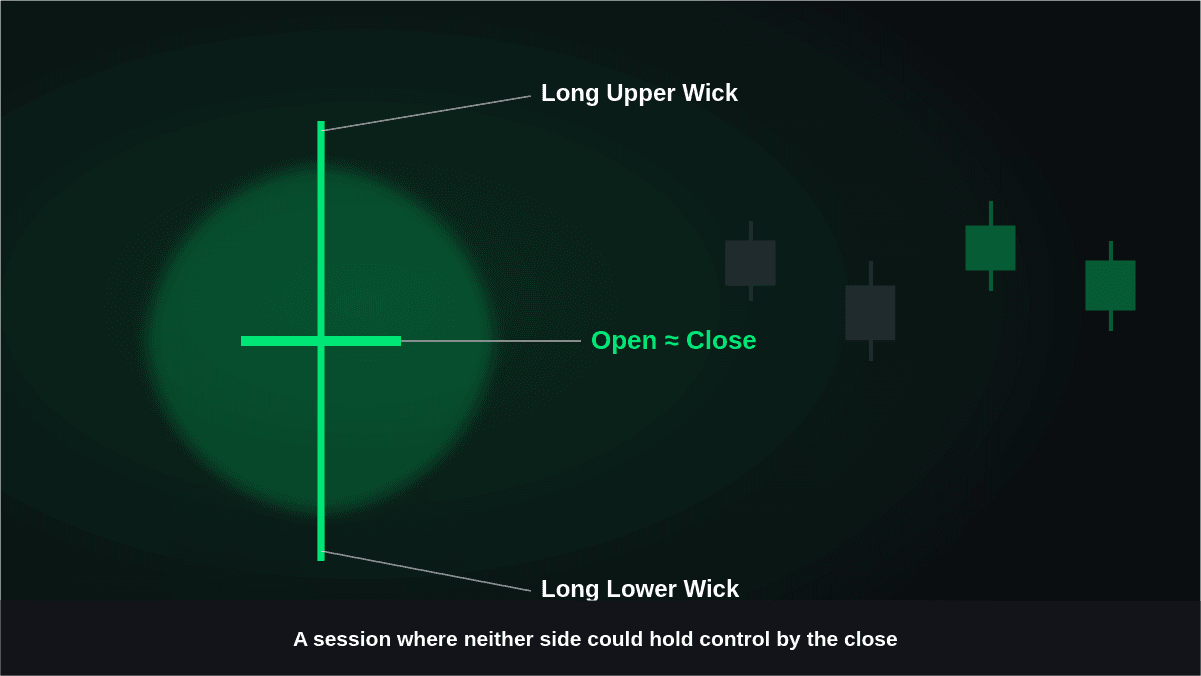
A Doji candlestick meaning is easiest to understand by looking at the relationship between its opening and closing prices. A Doji forms when the open and close occur at, or very close to, the same level, creating a small or nearly invisible real body. Unlike a large bullish or bearish candle, it shows that neither side clearly controlled the session by the close.

August 31, 2026
Read more
How to Spot and Trade the Reversal Using the Head and Shoulders Pattern
Trading

How to Spot and Trade the Reversal Using the Head and Shoulders Pattern

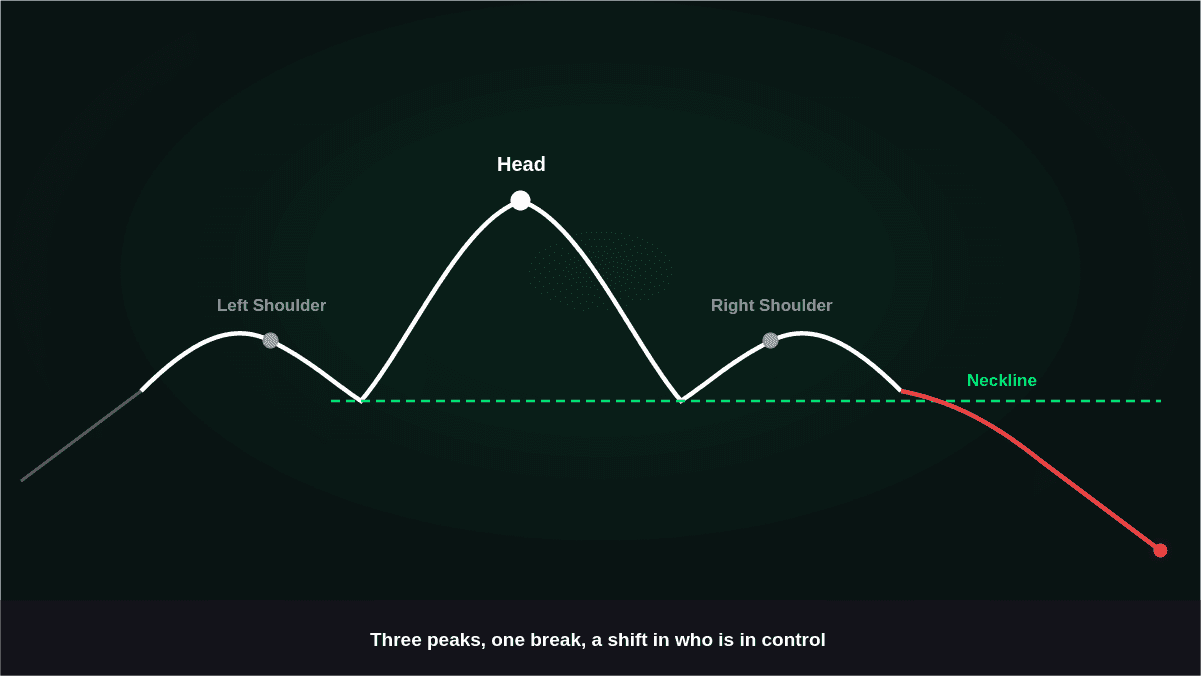
The head and shoulders pattern is among the most identifiable reversal patterns in technical analysis. This type of pattern may be used to detect that an existing trend might be weakening, thereby moving to a downturn. The traders do not just base their trading on the appearance of the pattern; they look at various factors including the trend, the neckline, and the risk involved.

August 31, 2026
Read more
Bullish and Bearish Engulfing Candlestick Pattern: A Trader's Guide
Trading

Bullish and Bearish Engulfing Candlestick Pattern: A Trader's Guide

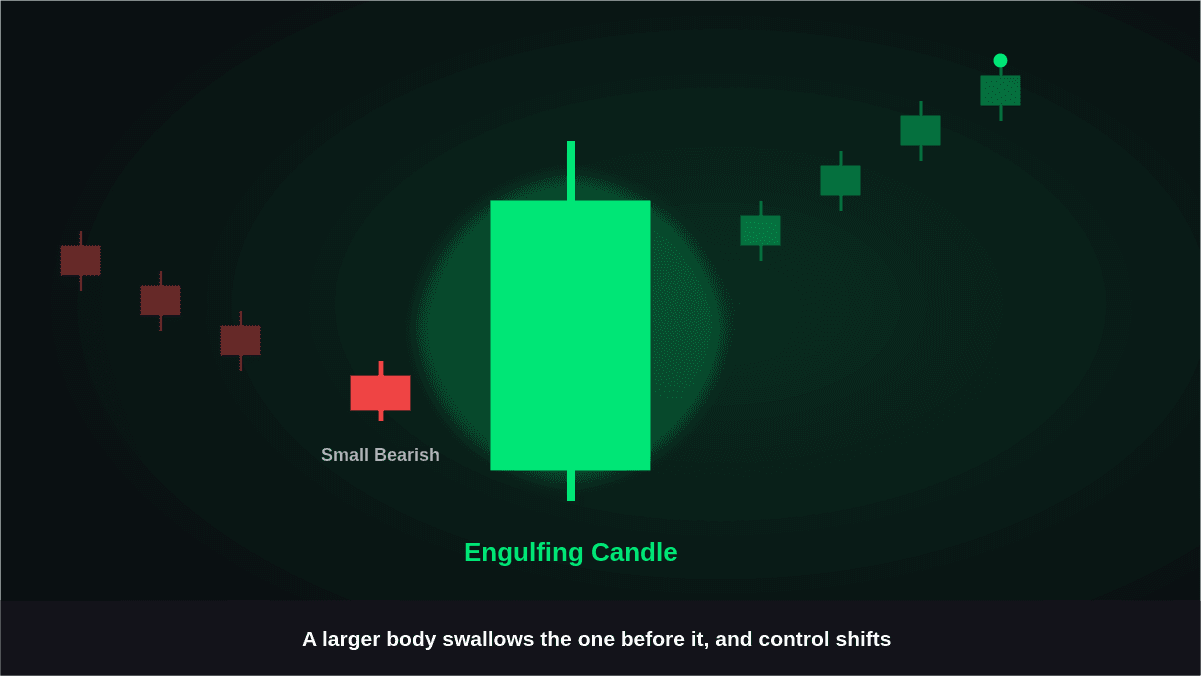
The bullish and bearish engulfing candlestick pattern is one of the clearest two-candle formations used by technical traders to identify a possible change in market direction. Instead of relying on a single candle, the pattern compares consecutive price action to show a shift in buying or selling pressure.

August 31, 2026
Read more