Trading Blog

Insights, strategies, and guides to help you trade smarter.

Supply and Demand Trading: How to Read Price Movement Between Key Zones
Trading

Supply and Demand Trading: How to Read Price Movement Between Key Zones

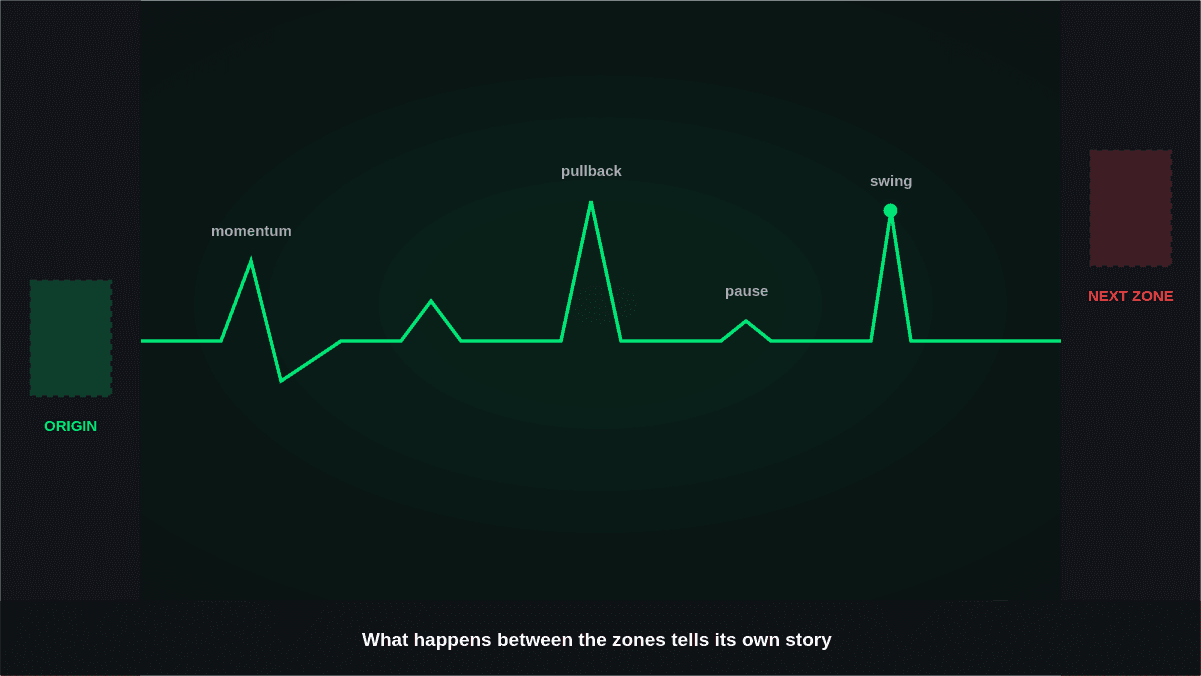
Supply and demand trading is often approached by focusing on important areas where price may react. But what happens after price leaves one area and before it reaches another can be just as informative. The movement between established reference points can show whether directional pressure is building, remaining consistent, or beginning to weaken.

August 28, 2026
Read more
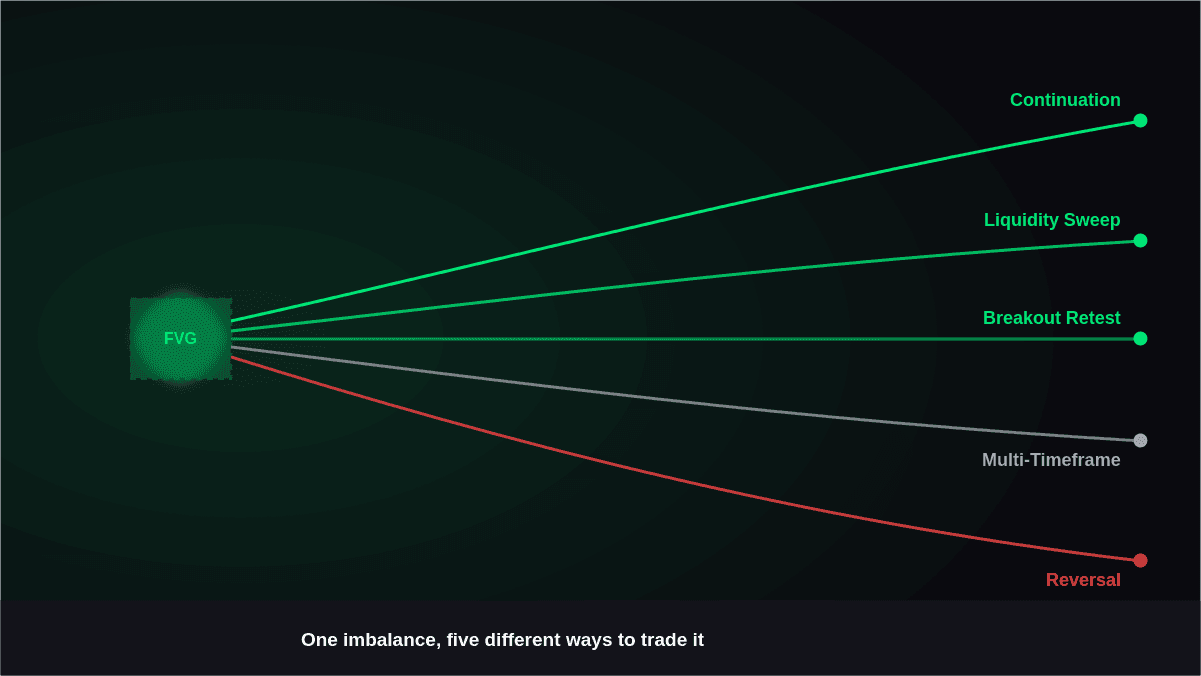
Top 5 Fair Value Gap Trading Strategies Every Trader Should Know
Trading

Top 5 Fair Value Gap Trading Strategies Every Trader Should Know

A fair value gap trading strategy can help traders study areas where price has moved rapidly and left an imbalance between candles. Instead of viewing an FVG as an automatic entry signal, traders can use these zones alongside market structure, liquidity, momentum, and

August 28, 2026
Read more
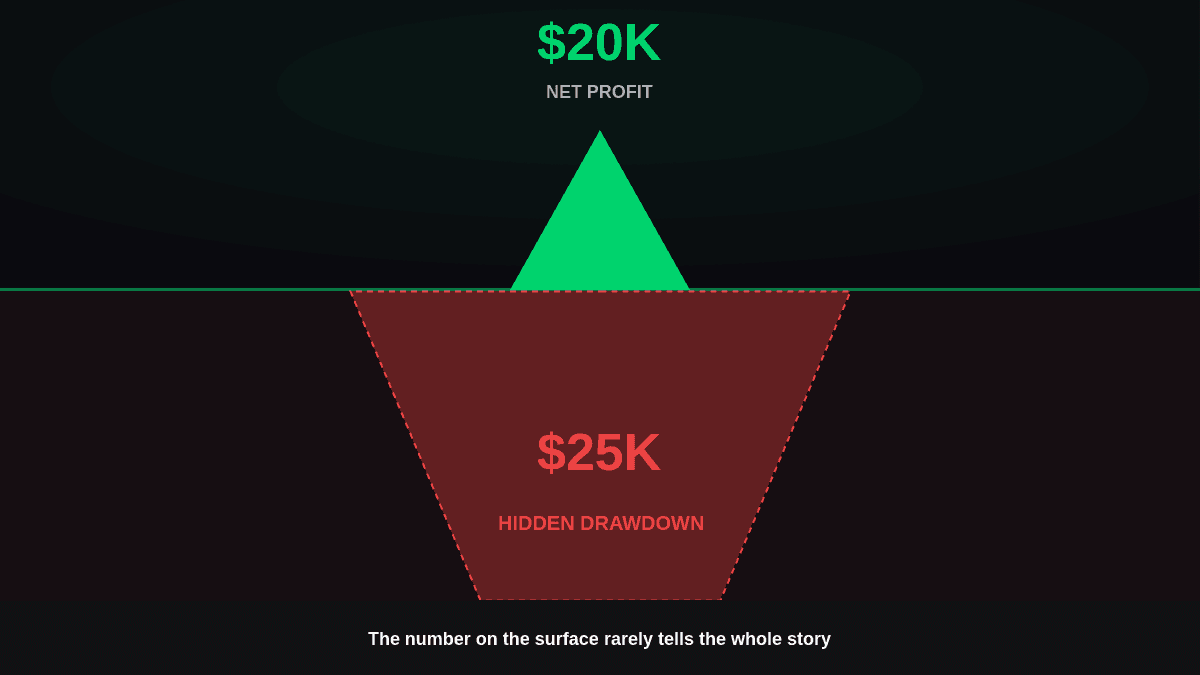
Top 7 Metrics for Backtesting Results
Trading

Top 7 Metrics for Backtesting Results

Backtest metrics allow traders to assess the strategy’s performance based on historical data. Considering just the overall return of a strategy will create an inaccurate assessment since two similar strategies may have different levels of risk and reliability.

August 27, 2026
Read more
Twelve Candlestick Patterns Every Trader Must Know
Trading

Twelve Candlestick Patterns Every Trader Must Know

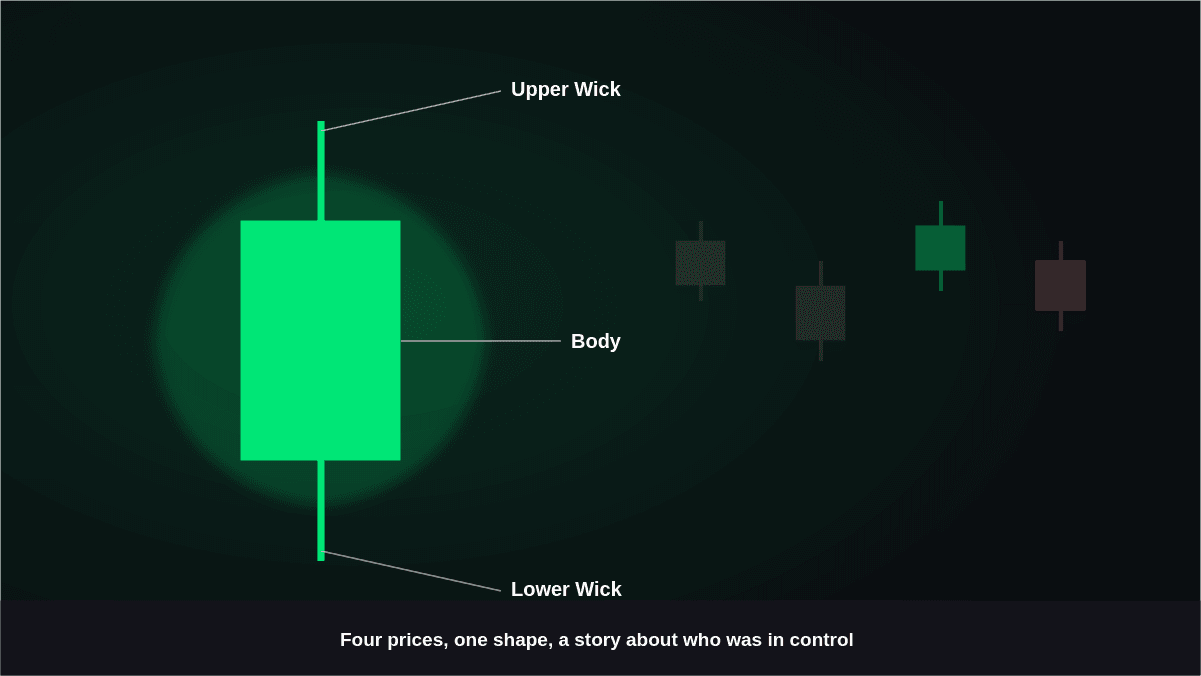
Candlestick patterns allow traders to gain insight into how the price acted during a certain time. In every candle there are four important prices: the opening price, the highest price, the lowest price, and the closing price. Such candlestick chart patterns may provide valuable insights into buying, selling, indecision, and the change in momentum.

August 27, 2026
Read more
Support Resistance: How to Identify and Trade Key Price Levels.
Trading

Support Resistance: How to Identify and Trade Key Price Levels.

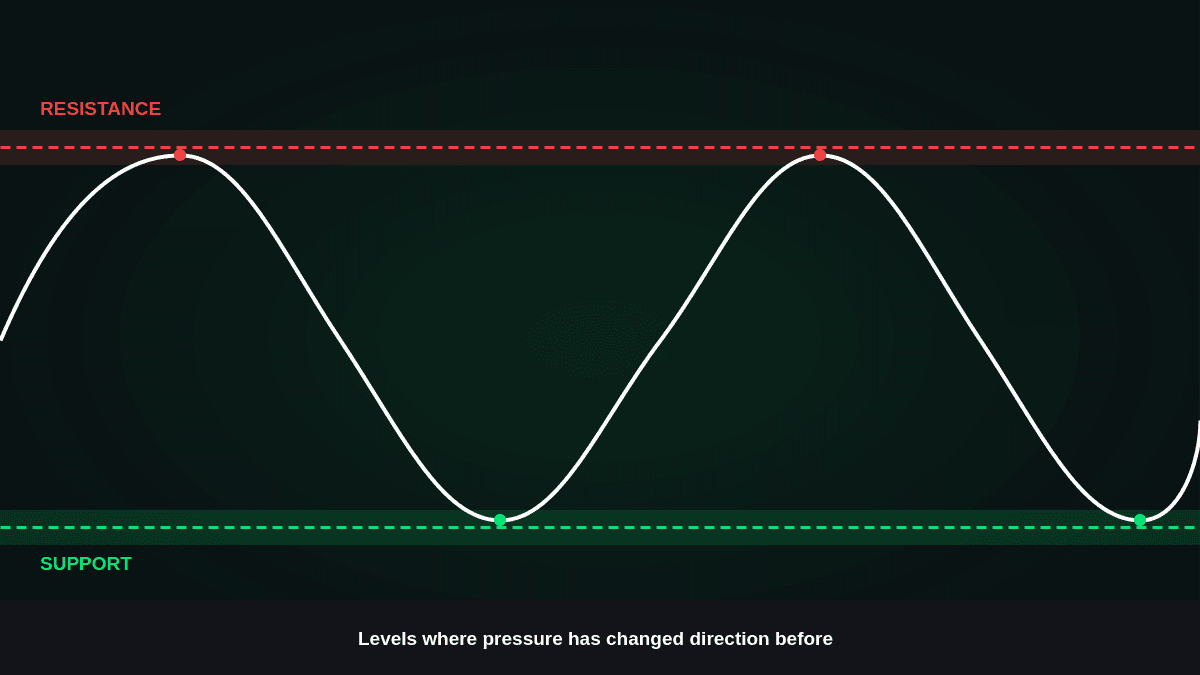
Support and resistance levels are widely used in technical analysis because they show potential price levels at which buying or selling pressure is likely to change.Support and resistance levels can be formed around previous highs and lows, consolidation zones, trendlines, and other areas where price has reacted numerous times.

August 26, 2026
Read more
How to Read Price Action and Identify Trends Using Market Structure
Trading

How to Read Price Action and Identify Trends Using Market Structure

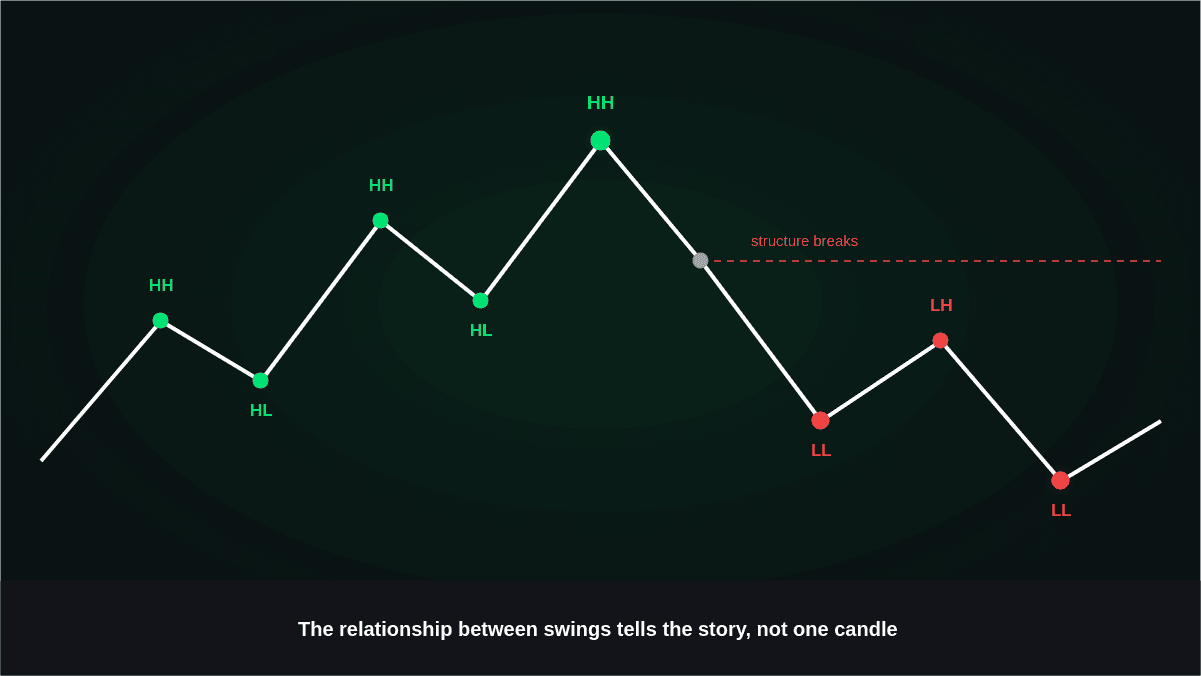
Market structure offers a framework to better understand the dynamics of prices in their high-low movements. Rather than examining each candle individually, the trader is able to analyze the relation between price levels in order to know whether the market is trending, ranging, or even reversing.

August 26, 2026
Read more