- 01
Open Trends
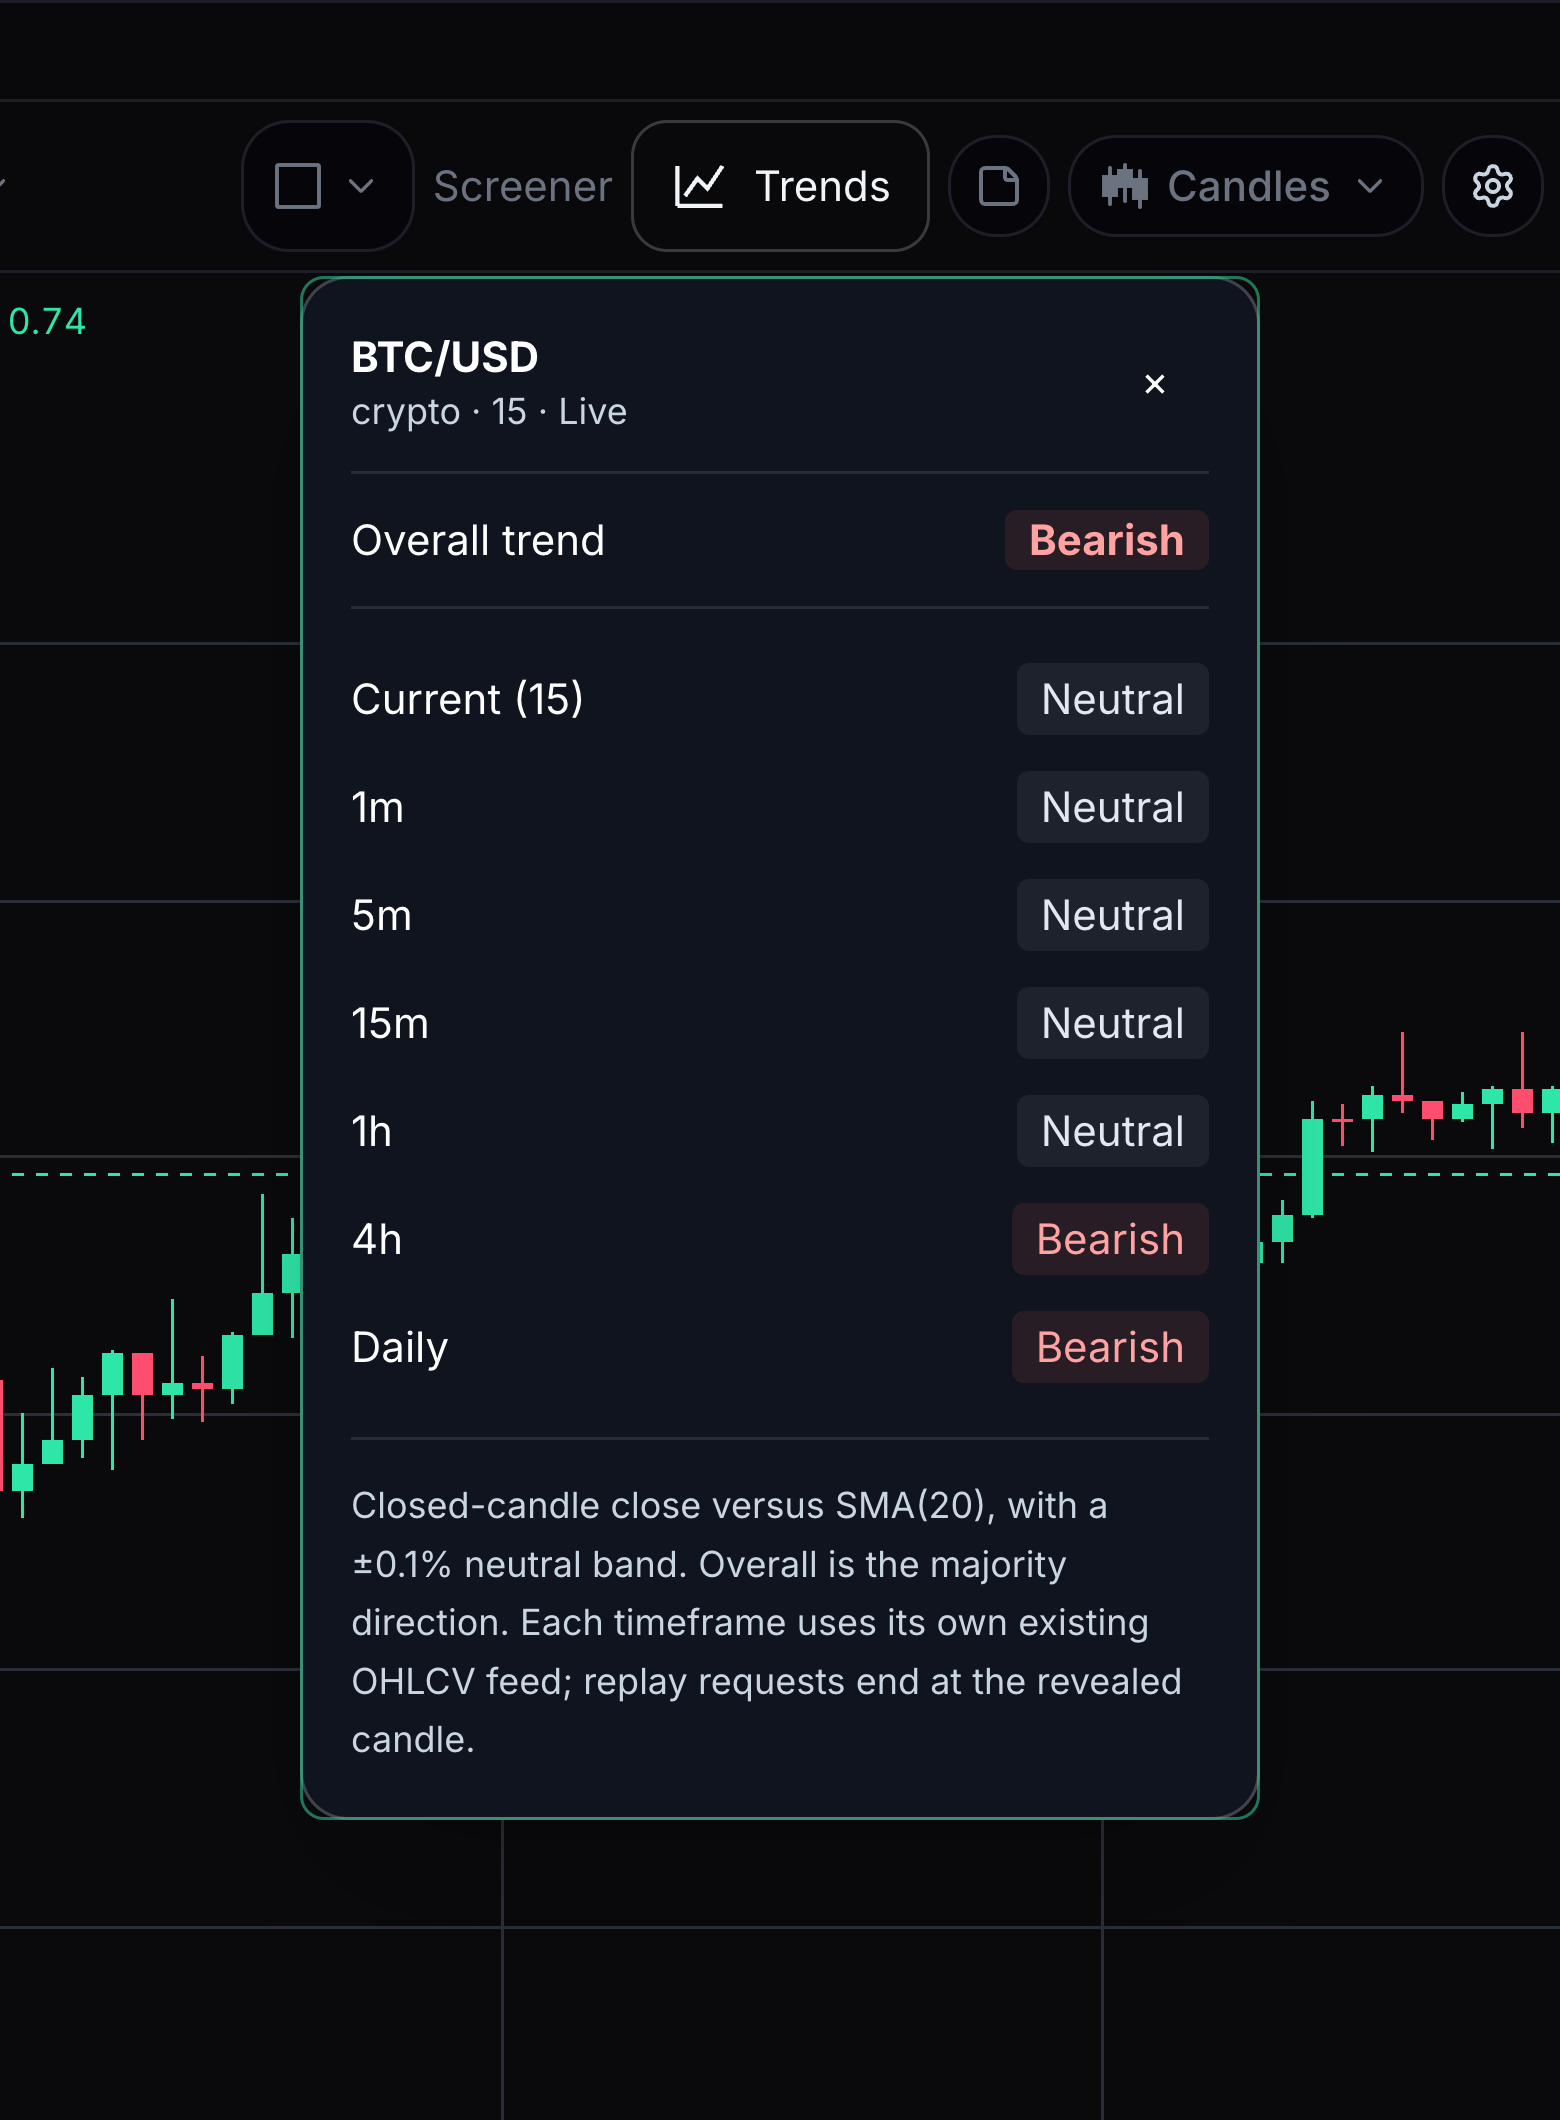
Trends summarizes the recent direction for several candle periods.
Select Trends in the chart header.
- 02
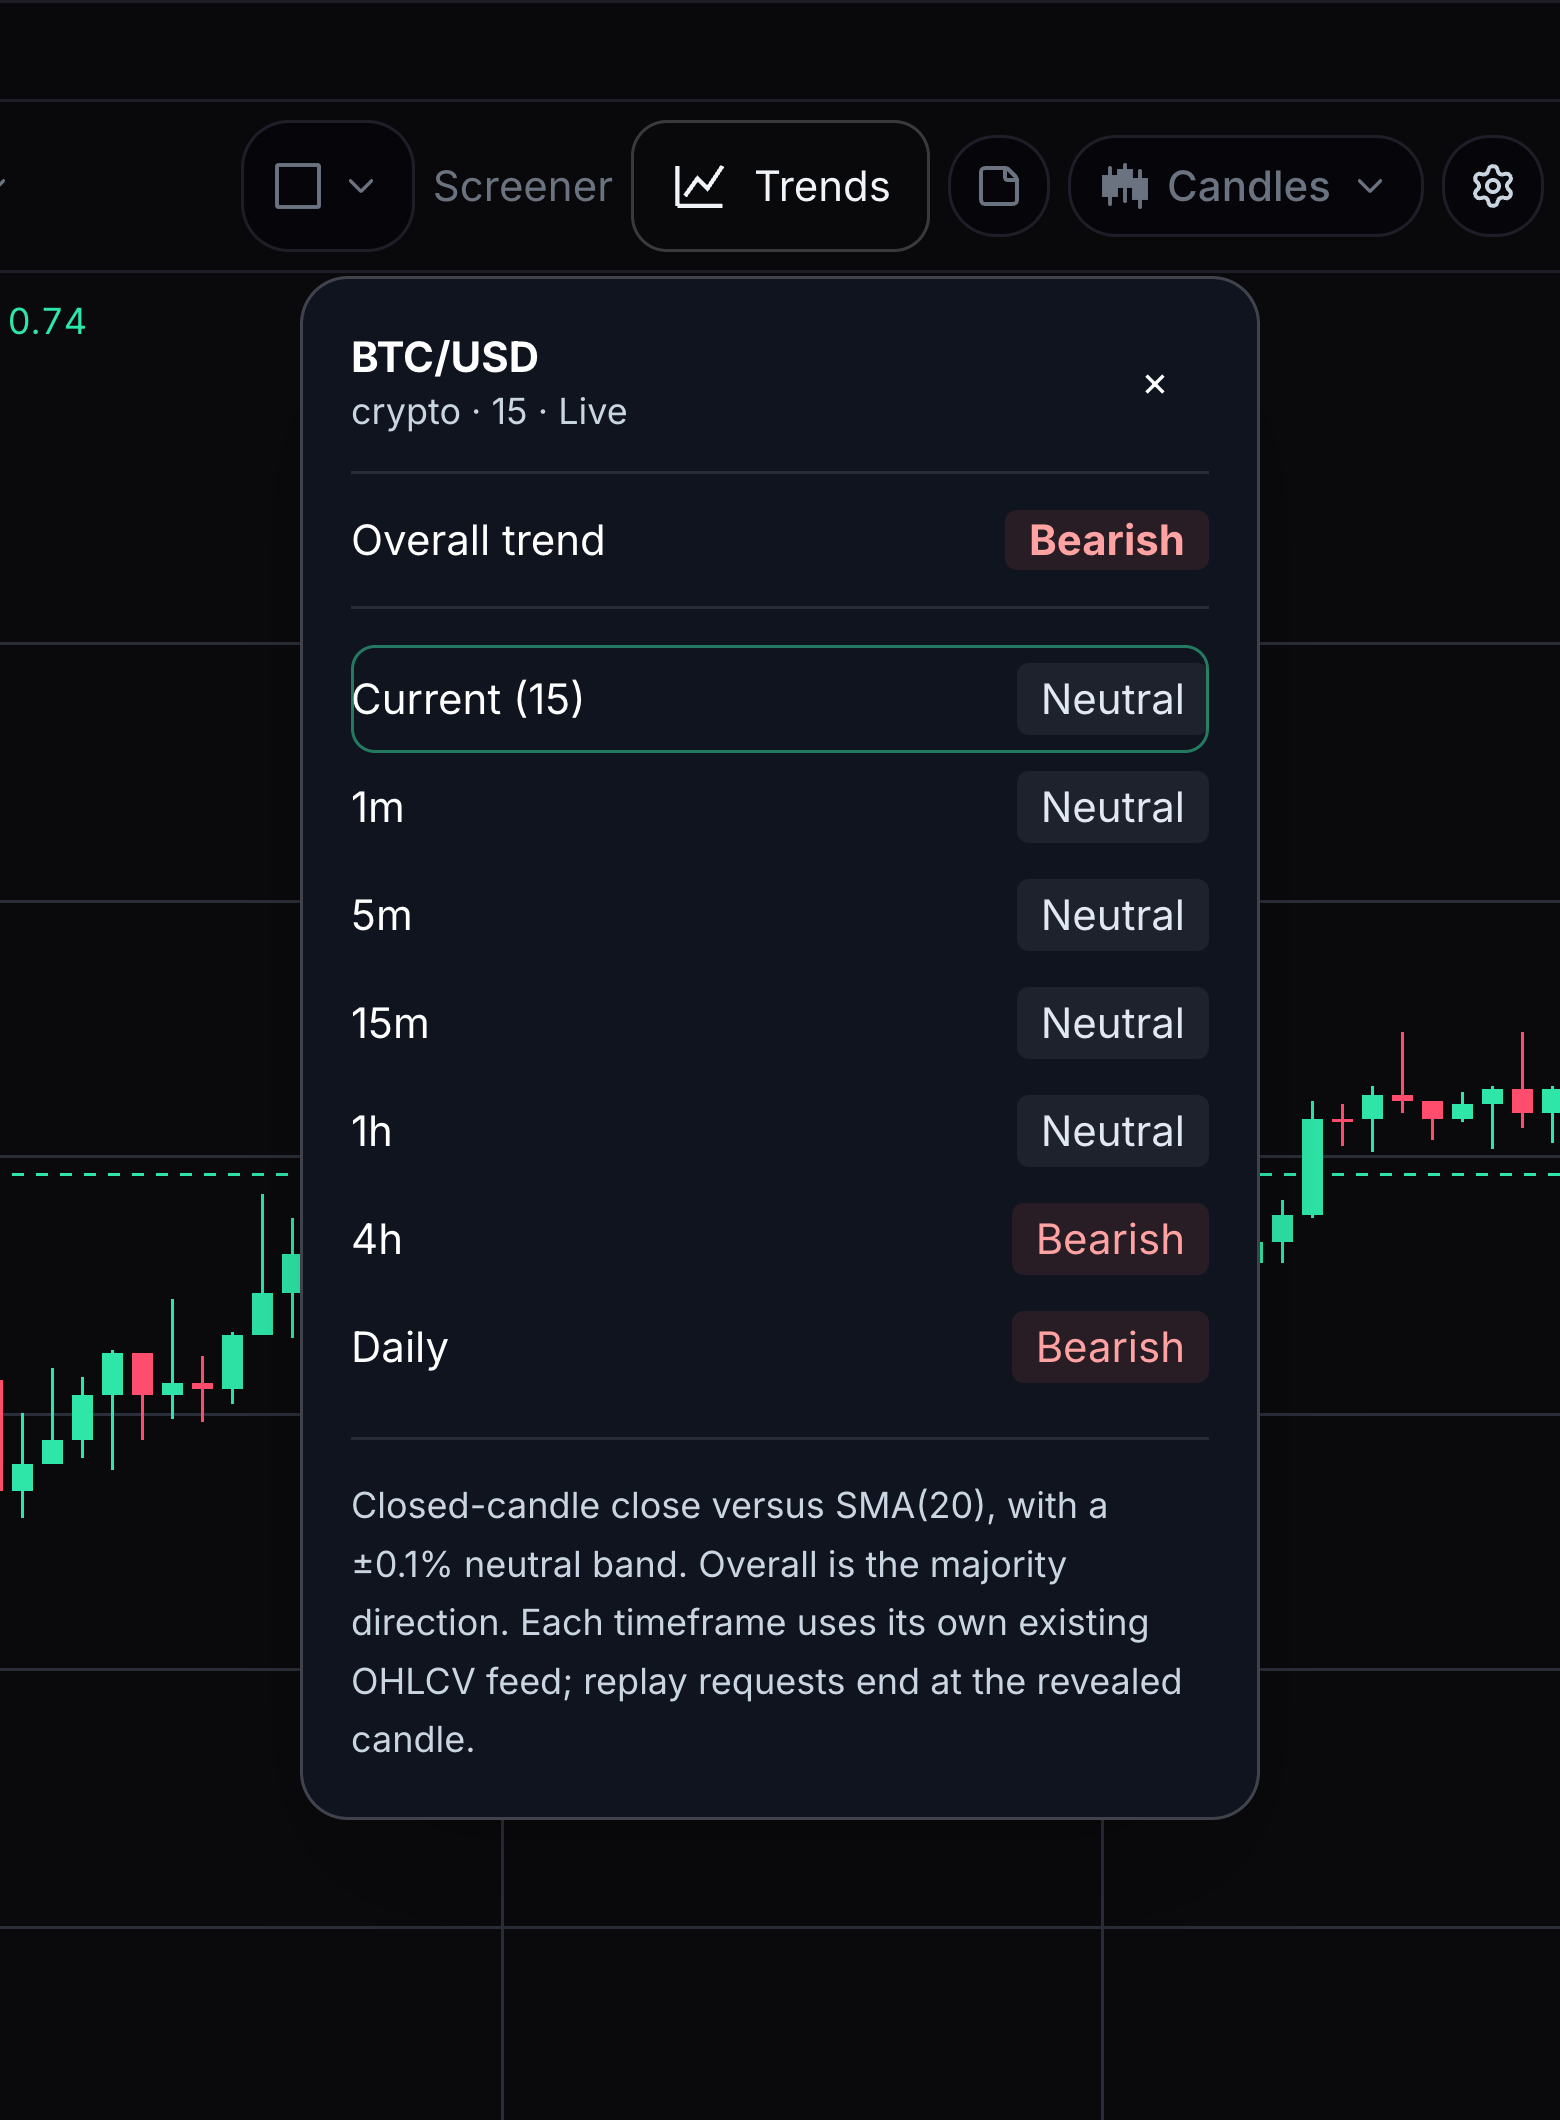
Read each timeframe
Each row compares the latest closed candle with the average of twenty closed candles. This is called a simple moving average, or SMA(20).
Read Bullish for more than 0.1% above the average, Bearish for more than 0.1% below it, or Neutral inside that band.
- 03
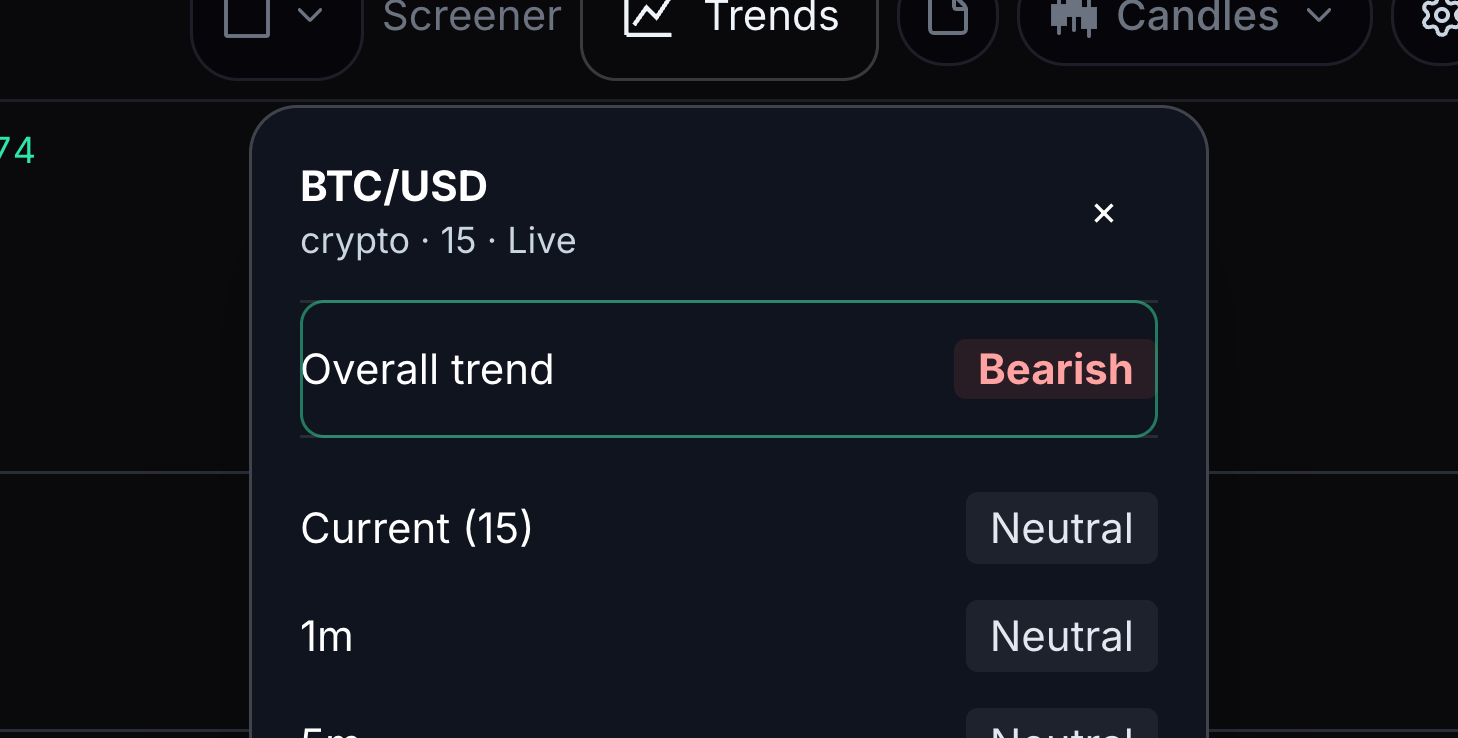
Read the overall result
Overall compares how many rows are bullish and bearish.
More bullish rows gives Bullish; more bearish rows gives Bearish. A tie is Neutral.
- 04
Close Trends
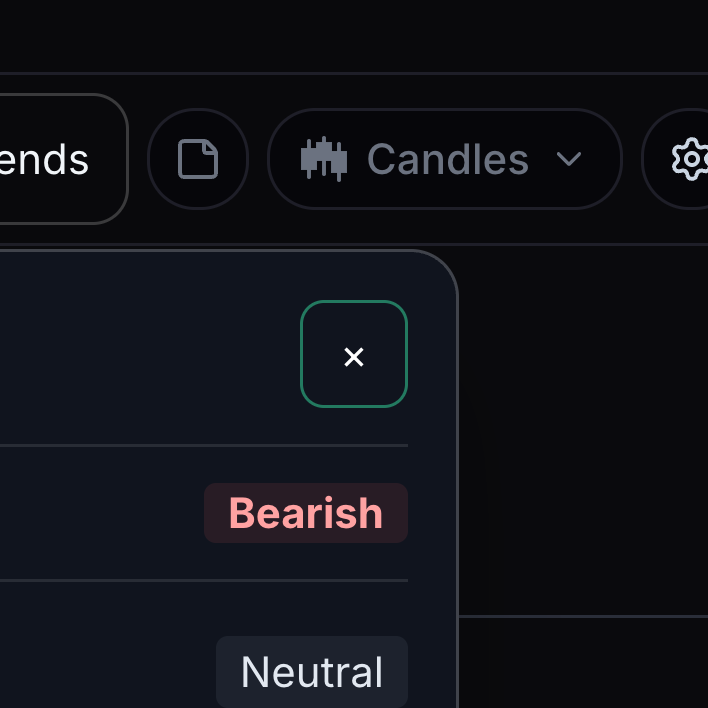
You can close Trends and return to the chart.
Choose the × in the top-right corner of Trends. Select Trends in the chart header to open it again.


Keep learning
Was this helpful?